Cumba Data Browser - User Manual
Manual v0.5 - last reviewed against Cumba Data Browser 0.5.4.0 on 30 August 2026
⚠️ Disclaimer: All sample data shown in this manual is provided by CDISC and PHUSE as freely available CDISC-pilot examples. No real clinical or patient data is used.
💡 This manual describes what each feature is. If you would rather be walked through a real task from start to finish, the User Guide does that - one everyday review workflow, step by step, with the shortcuts along the way.
1. Introduction
The Cumba Data Browser is a generic tool for exploring tabular data - supporting a wide range of file formats and giving you a fast, modern way to inspect, filter, sort, transform, and visualize any dataset.
Cumba was developed by people who have spent 25+ years in clinical and preclinical data analysis, so the tool is specifically optimized for CDISC-aligned workflows (SDTM, ADaM, SEND). But the core engine is fully generic: most features work on any tabular data, regardless of domain.
What works on any dataset
- Loading, viewing, navigation
- Filtering, searching, sorting, grouping
- Column management (hide, pin, reorder, find)
- Statistics (frequencies, descriptive)
- Charts and visualizations
- Format conversion (read/write any supported format)
- Dataset comparison
- SQL queries
- Smart Number Display, tooltips, column markers
- Multi-pane workspace, split layouts
- AI Agent
Clinical/preclinical-specific features
These only become meaningful with CDISC-aligned data:
- Quick Merges with standard CDISC domains (DM, ADSL, SUPP, SUPPDM)
- Optimized Transpose for ADaM BDS structures
- Pinnacle 21 and CDISC Core validation findings overlay
- Define-XML integration (display, validation, metadata)
- CDISC Library API access (requires your own API key, currently configured in databrowser.properties)
- SEND-IG support for nonclinical/animal study data
Designed for
- Non-technical users who need a quick look at their data
- Data managers, statisticians, and analysts who inspect, transform, validate, or compare datasets
- Clinical and preclinical programmers working with CDISC standards
- Anyone who wants a modern, fast, intuitive data browser without the overhead of larger systems
Key principles
- Intuitive - no scripting required for everyday tasks
- Minimal visual noise - the UI only highlights what matters (outlier marking, on-demand tooltips)
- Fast - optimized for large datasets
- Multiple datasets and formats can be open in parallel
- SQL-native - every UI action translates to SQL under the hood
- Fully scalable interface - seamless zoom in/out, crisp at any zoom level
Installing Cumba
Cumba is a desktop application. It is installed locally and runs on your own machine - there is no cloud requirement and no account. Download the current release for your platform from cumba.net:
| Platform | Package |
|---|---|
| Windows | x64, ZIP |
| macOS | Apple Silicon, DMG |
| Linux | x64, TAR.GZ |
| Any platform with a JVM | Cross-platform Java, ZIP |
The Windows, macOS and Linux packages bring their own Java runtime - nothing else needs to be installed. The cross-platform ZIP expects a JVM already on the machine.
Memory: 8 GB of RAM is the minimum, 16 GB is recommended. That is a laptop, not a server - and it is enough for production-sized data:
| A 5 GB SAS file | opens in under 500 MB of memory |
| 5 million rows | sorted in under a second |
| 50 million rows | loaded and browsed without paging |
Cumba reads whole datasets rather than paging through them, so scrolling, sorting and filtering stay immediate once a file is open.
2. Data Access & Formats
2.1 Supported File Formats
Cumba can both read and write the following formats:
- SAS7BDAT - SAS dataset
- XPT - SAS transport file
- Parquet - columnar storage format
- Dataset-JSON - CDISC's JSON-based dataset standard, in all three of its shapes:
.json, line-delimited.ndjson, and compressed.dsjc - RData / RDS - R data formats.
.RData(also written.rda) holds one or more named objects saved withsave();.rdsholds a single object written withsaveRDS() - XLSX - Microsoft Excel workbooks (read and write, including export of multiple datasets to multiple sheets in a single file)
- CSV - comma-separated values
2.2 Data Conversion
Two ways to save data in another format:
File → Export- quick save of the currently active dataset, optionally in a different formatTools → Convert Data…- full-featured converter; supports single files, entire libraries, and dataset expansion for performance testing
2.2.1 Convert Data Dialog
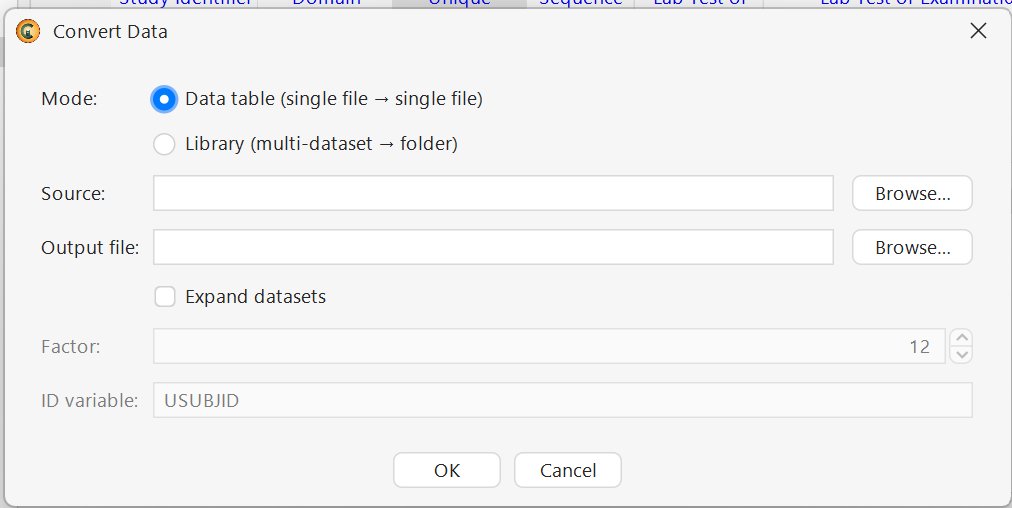
The Convert Data dialog has two modes:
| Mode | Use |
|---|---|
| Data table (single file → single file) | Convert one file to another format |
| Library (multi-dataset → folder) | Convert all datasets in a folder/library |
Optional: Expand datasets mode generates large synthetic datasets from real ones by replicating rows with new unique IDs.
| Field | Description |
|---|---|
| Expand datasets (checkbox) | Enable expansion mode |
| Factor | Multiplication factor (e.g. 12 → 12× the original size) |
| ID variable | Subject identifier to be uniquified across copies (e.g. USUBJID) |
💡 Expand datasets use cases: performance testing, large-scale demos, workshop datasets, stress-testing pipelines. Because the expanded data is based on real source data, distributions and structures stay realistic - unlike random synthetic generation.
Define-XML alongside the data. Convert Data does more than move bytes between formats:
| Option | What it does |
|---|---|
| Check Define-XML conformance | Validates a Define-XML against the standard before you rely on it - the metadata gets the same scrutiny as the data. |
| Generate Define-XML | Writes a Define-XML describing the converted output, so the metadata travels with the datasets instead of being rebuilt by hand at the other end. |
⚠️ One thing to know before you convert: a loaded dataset has its proposed order applied, and it is that sorted view which gets exported. The output can therefore be ordered differently from the source file. If byte-for-byte row order matters - for a submission, or for a diff against the original - check the order after converting. (The CDISC rule engine deliberately undoes this, because rules must evaluate in source row order.)
During library conversion, Cumba shows a live counter of the dataset being processed and its position in the library (e.g. Converting LB (6/22)…), so you always see real progress on long-running jobs. An Abort button lets you cancel at any time. When the conversion finishes, the status bar shows a confirmation with timestamp, count, and target path (e.g. Converted 22 of 22 datasets to C:\test data) - no modal dialog to dismiss.
💡 Convert Data is a data conversion from one location or storage format to another. Accompanying formats are now included in the conversion - variable formats are carried along with the data, for target formats that have a concept for them. Other format-specific considerations: - Parquet has no standard concept for formats/codelists, so carrying format information into Parquet is not straightforward. - A library can be exported into one file - an Excel workbook with a sheet per dataset, or a single XPT with one member per dataset. Both formats cap member names (31 characters for Excel, 8 for XPT); where two dataset names would collide after truncation, Cumba renames them apart and reports the renames rather than silently merging them. Appending a colliding member to an existing XPT is refused.
2.3 Support for CDISC standards
This section describes Cumba's CDISC-specific capabilities. For non-CDISC data (any other tabular dataset), all the generic features described elsewhere in this manual still apply.
Cumba supports the major CDISC standards out of the box:
- SDTM - Study Data Tabulation Model (clinical patient data)
- ADaM - Analysis Data Model (clinical analysis datasets)
- SEND - Standard for Exchange of Nonclinical Data (preclinical/animal studies; structurally based on SDTM)
- Define-XML - read, display, and use for validation and metadata
- CDISC Library API - access to controlled terminology and standards metadata, using your own API key (currently configured in
databrowser.properties) - Open Study Builder - open an OSB instance as a library via its API URL (
File → Open Library → From URL), inspect its metadata like any other Cumba library
💡 To enable the CDISC Library API, register at www.cdisc.org/cdisc-library/api for an API key, then uncomment and set the corresponding lines in
databrowser.properties:-Dcdisc.library.api.key=<your-key> -Dcdisc.library.api.url=https://api.library.cdisc.org/api/ -Dcdisc.library.api.cache="%USERPROFILE%/.cumbaDataBrowser/cdisc_api_cache"
2.4 Encoding & Internationalization
Cumba fully supports UTF-8 / Unicode, including CJK scripts (Chinese, Japanese, Korean), accented Latin characters, and other international scripts. This matters for global clinical trials where reported terms (e.g. AETERM, MHTERM) may contain text in local languages.
2.5 Remote Data Access
Clinical data often may not leave the server it lives on. Cumba can work on that data where it already is: a Cumba backend process runs on the remote machine, reads the files there, and sends only what the view needs back to your screen. The datasets themselves - and every filter, sort, merge and query you run on them - stay on the server.
What it feels like: the same as local. Remote folders are browsable in the Open dialog like any other directory, remote datasets open as regular tabs, and every feature in this manual works on them.
Two ways to connect:
| Transport | Use |
|---|---|
| SSH | The usual case. Cumba connects over an ordinary SSH login, starts a backend session on the server, and talks to it through that same connection. Nothing has to be opened on the server beyond the SSH port you already use. The remote filesystem is browsed over SFTP. |
| HTTP(S) | For a backend that is already running as a service and reachable over HTTP. Configured with the endpoint URLs of the running backend. |
Requirement: the Cumba backend has to be installed on the remote machine. It is the same distribution, started in backend mode; your own SSH account and its file permissions decide what you can see.
If the connection drops: Cumba and the backend exchange a heartbeat, so a dead connection is noticed rather than hanging. Reconnecting resumes the same session - the datasets you had open on the server are still open, and the work is not repeated. A session whose client has vanished for good is released on the server after a few minutes.
💡 Why this matters in a regulated environment: nothing about the setup is a copy. There is no local cache of the study to account for, no export step, and no second place where the data now also exists. What travels over the wire is a view.
3. Interface Overview
The application is divided into three main areas:
| Area | Name | Purpose |
|---|---|---|
| A | Top Menu & Toolbar | File · Edit · Display · Columns · Sort · Filter · Tools · Help - plus the toolbar below |
| B | Library Explorer (left) | Lists all loaded libraries, datasets, and formats |
| C | Workspace (right) | Tabs for opened datasets and formats |
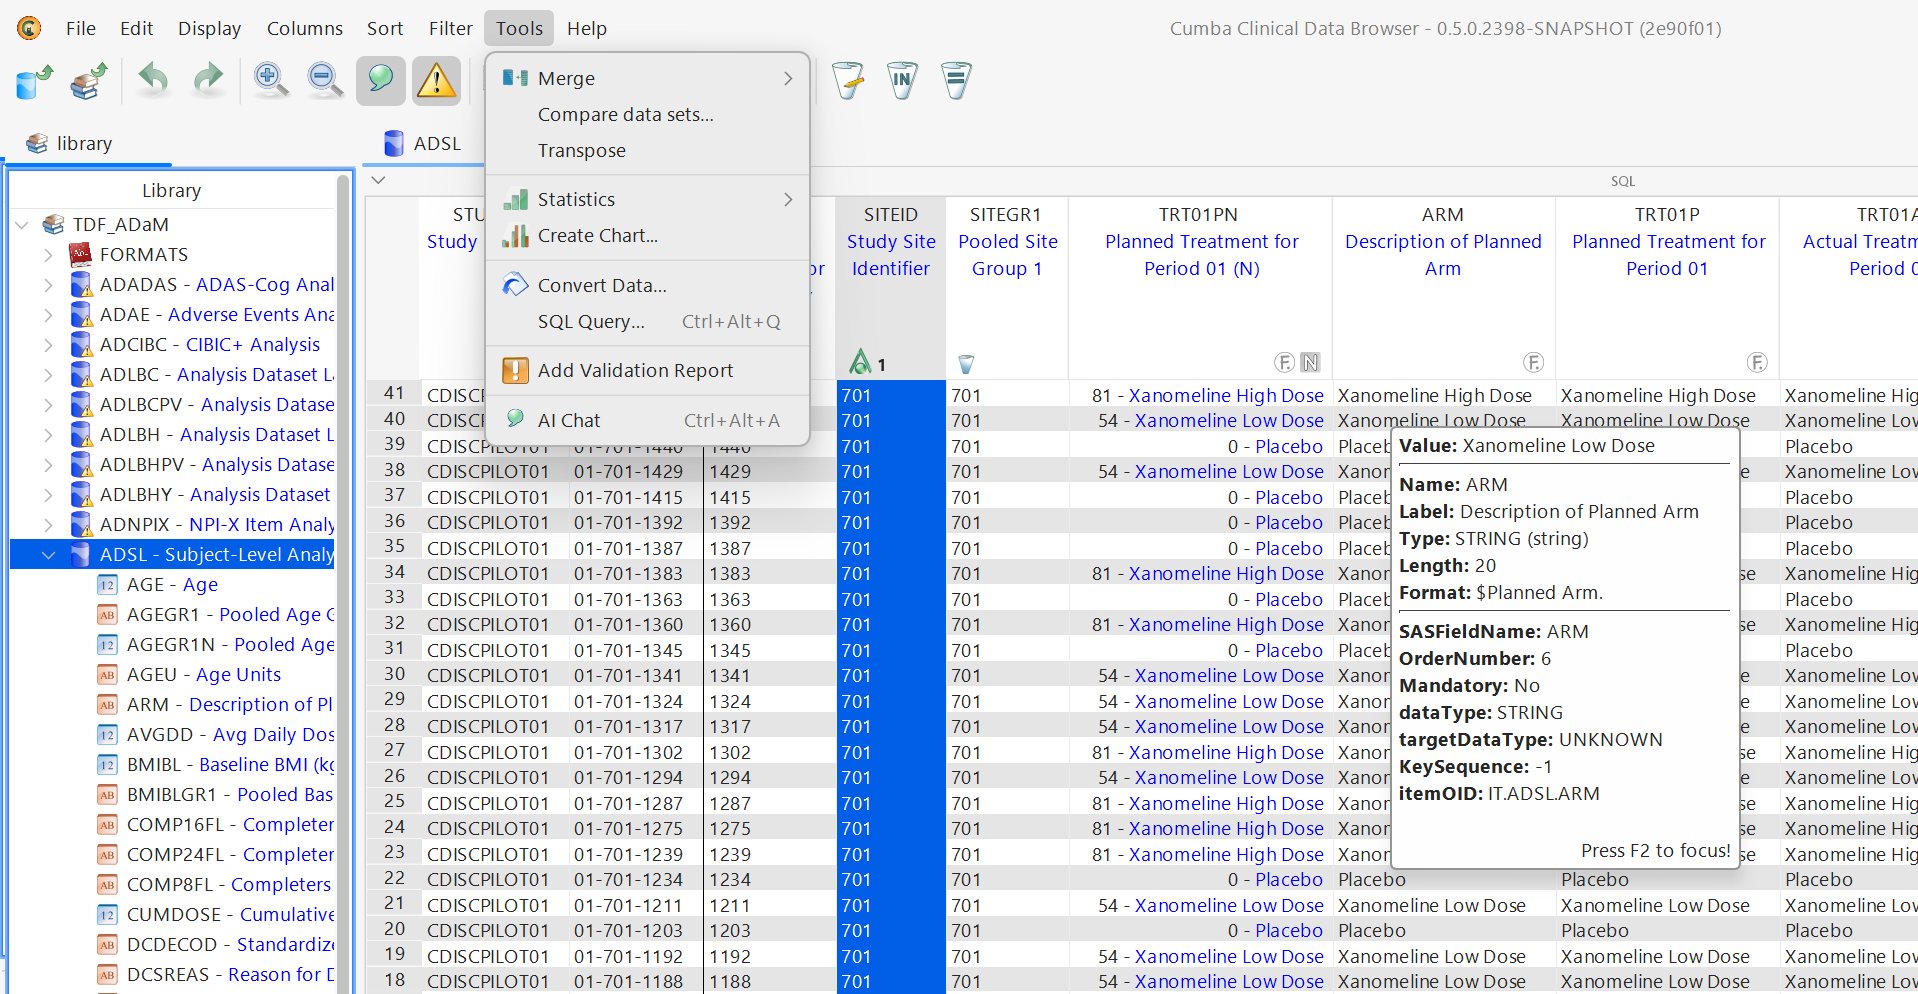
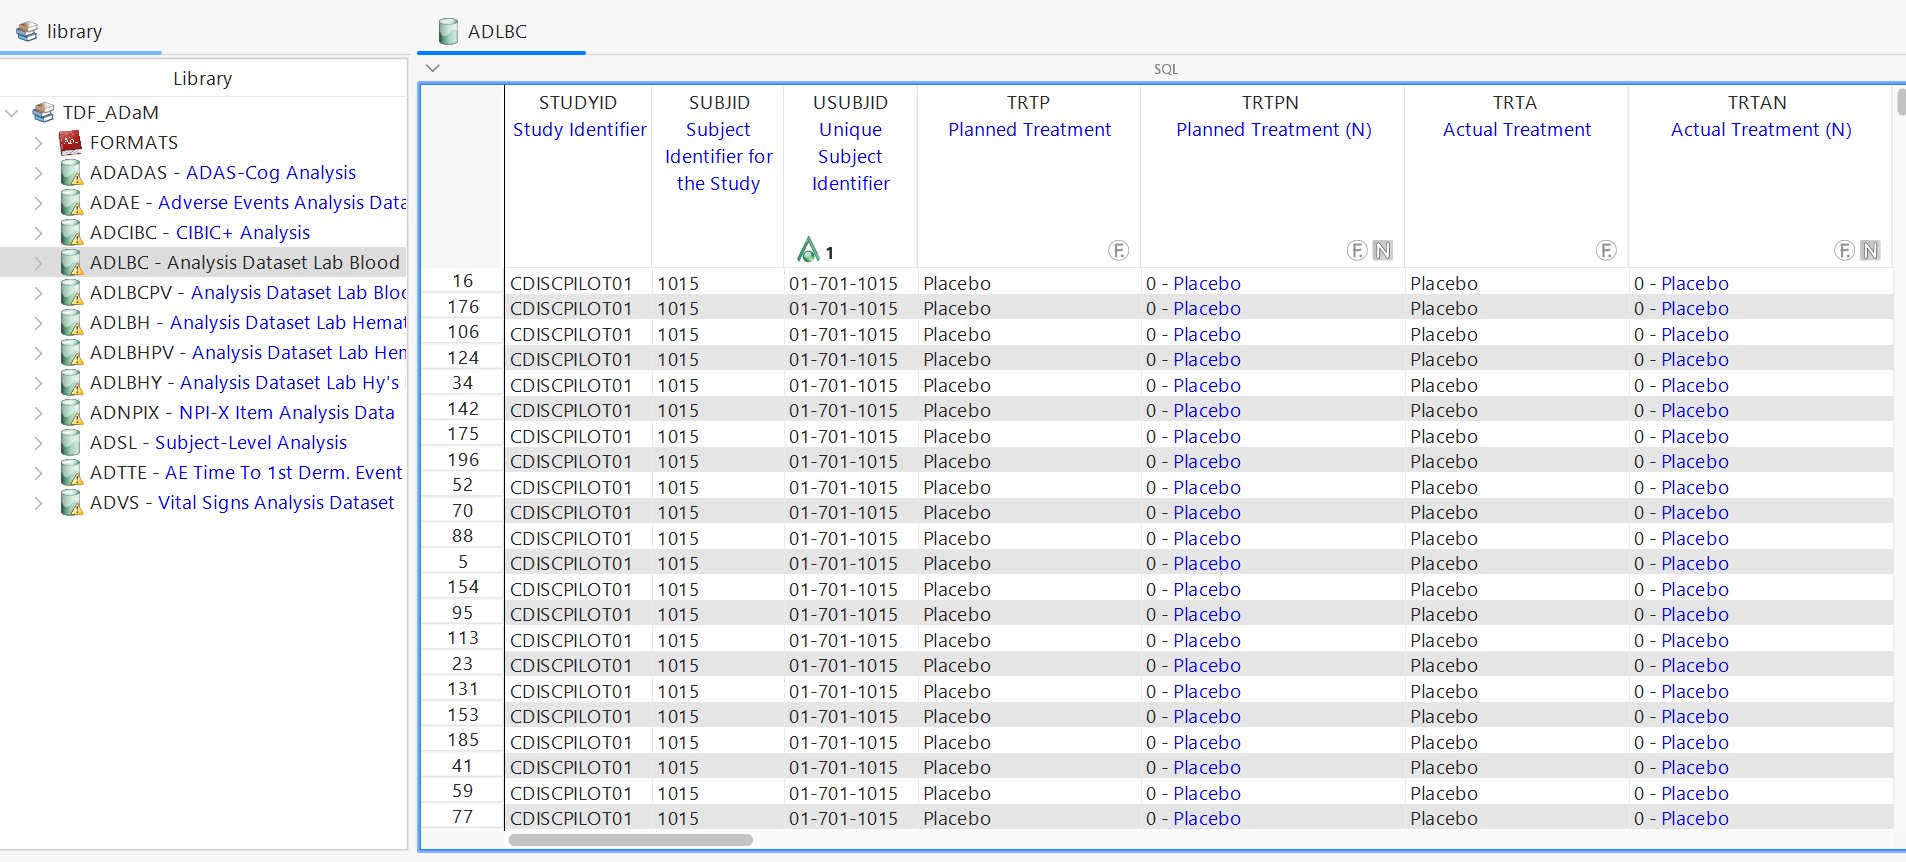
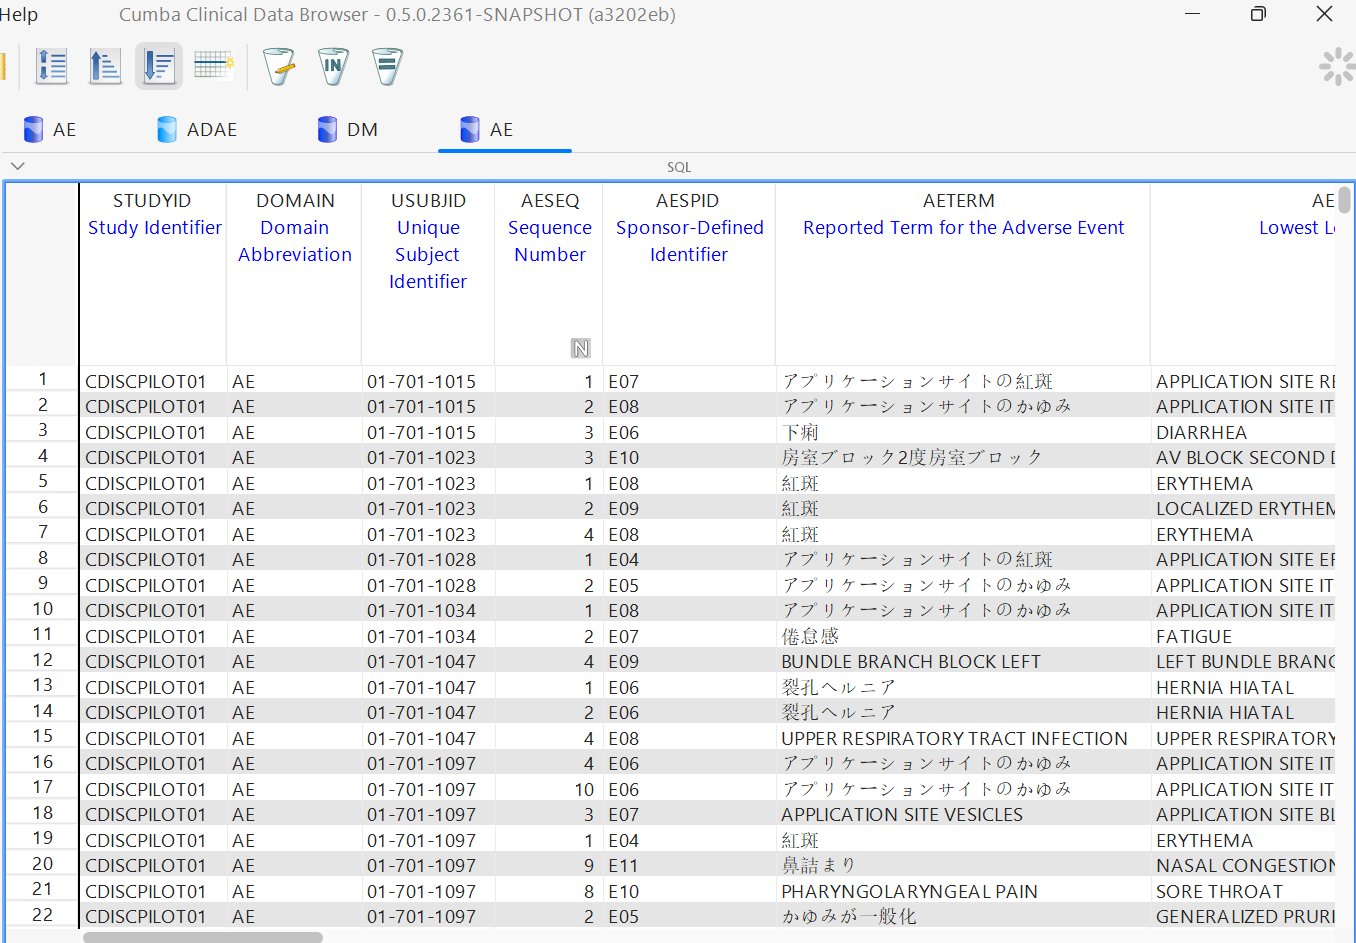
A lot of this manual is visible in that one shot: the FORMATS node at the top of the library, ⚠️ markers on the datasets that carry validation findings, F and N markers in the column headers, treatment codes shown as 0 - Placebo (native in black, decode in blue), row numbers that are not consecutive because the view is sorted, and the collapsed SQL bar above the table.
💡 Right-click menus matter. Many of Cumba's most useful functions live only in the right-click context menus - on cells, columns, datasets, and libraries. The top menu bar shows the global functions; the context menus expose the targeted ones. If you only use the top menus, you will miss important features. Whenever you wonder "is there a way to do X here?", right-click first.
3.1 Workspace Layout (Split Panes)
The Workspace can be divided into multiple panes for side-by-side viewing of datasets, formats, statistics outputs, or the AI Agent. There are four ways to manage the layout - pick whichever feels most natural:
- Drag tabs to side or bottom edges → splits the pane in that direction (most intuitive)
Display → Container ▶→ menu-driven placement (Top / Bottom / Left / Right) for the active tabDisplay → Perspective ▶→ preset layouts (Reset to Default / Classic (no AI) / Chat Right / Chat Bottom)- Right-click on a tab → tab context menu (see below)
Tab context menu - right-click on any tab in the Workspace:
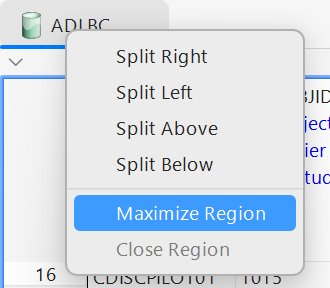
| Action | Effect |
|---|---|
| Split Right / Left / Above / Below | Move the tab into a new pane in that direction |
| Maximize Region | Temporarily enlarge the current pane to fill the Workspace; click again to restore. Double-clicking the tab does the same - the fastest way to give one dataset the whole window and hand it back. |
| Close Region | Close the current pane (only available when multiple panes exist) |
To undo a split: drag a tab back into another pane. When a pane has no tabs left, the split collapses.
💡 Typical use cases: - Compare two datasets side-by-side (e.g. SDTM
AEvs. ADaMADAE) - Keep raw data visible while inspecting Frequency or Descriptive results - View source and target of a Merge or Transpose simultaneously - Data on the left, AI Agent on the right
4. Libraries, Datasets & Formats
4.1 Libraries
A Library is a container holding one or more datasets and (optionally) formats.
- Open Library -
File → Open Library, with three options: - From File - open a single file as a library
- From Folder - open all datasets in a directory as one library (typical for an SDTM study folder)
- From URL - open an Open Study Builder (OSB) instance as a library by entering its API URL (e.g.
https://osb.cumba.net/api). Cumba reads the OSB metadata directly from the API and exposes it as a regular library.
When opening a library, Cumba uses the selected folder name (or file name) as the default library name. The Open dialog only asks for the name. To add or change a descriptive label (e.g. "CDISC SDTM 3.1.2"), use Rename Library… from the library's right-click menu - the rename dialog lets you edit both name and label. A label is optional. If set, the library is shown as <Name> - <Label> in the explorer, with the name in dark and the label in blue - the same visual convention used for datasets and variables. Without a label, only the name is shown.
- Open Data Set -
File → Open Data Set - Recent Files -
File → Recent Files - Remove Library -
Ctrl+Alt+CorFile → Remove Library. Files on disk are not affected. - A Library may contain a FORMATS node, always shown at the top.
4.1.1 Library Context Menu
Right-click a library in the Library Explorer for library-level actions:
| Action | Shortcut |
|---|---|
| Open Library ▶ | – |
| Rename Library… | – |
| Remove Library | Ctrl+Alt+C |
| Lock In Memory | – |
| SQL Query… | Ctrl+Alt+Q |
| Add Validation Report | – |
| Show Validation Report | – |
| Check Using CoreJ… | – |
💡 "Lock In Memory" keeps all datasets of the library loaded in RAM, so subsequent access is fast - at the cost of memory. Useful for libraries you switch between often.
4.1.2 Dataset Icons (Color-Coded by Format)
Datasets share a common barrel ("can") shape as their icon - both in the Library Explorer and in the Workspace tab header. The color identifies the file format; no letter labels are used:
| Color | Format(s) |
|---|---|
| 🟦 Light blue | SAS (.sas7bdat, .xpt) |
| 🟨 Gold | JSON (all variants, including Dataset-JSON) |
| 🟩 Green | Parquet |
| ⬜ Grey | CSV, XLSX, RData/RDS |
Formats use the same barrel shape but always in grey, regardless of source - so a format tab is visually distinct from a dataset tab at a glance. See Section 4.3.
4.2 Datasets
- Open a dataset: double-click in the Library → opens as a tab in the Workspace.
- Close a tab: hover over the tab to reveal an
✗icon, or useCtrl+W(Close View). - Multiple datasets and formats can be open at the same time.
4.2.1 Dataset Context Menu
Right-click on a dataset in the Library Explorer:
| Action | Description |
|---|---|
| Open Library ▶ | Library-level actions |
| Open | Open the dataset (default) |
| Open With Properties… | Open in a new tab and prompt for provider properties (e.g. CSV delimiter, Excel sheet, JSON path) - useful when auto-detection picks the wrong settings |
| Edit | Edit the data in this dataset (read-only by default; see note below) |
| Check Using CoreJ… | Run CoreJ validation on this dataset |
📝 On Edit: changes cannot be saved back to the original file - modified data can only be exported under a new name. Edit is intentionally not a central function of Cumba; it's available for occasional ad-hoc adjustments only.
4.2.2 Variable List in the Library Explorer
Expand a dataset in the Library to see its variables. Each entry shows:
- Variable name (e.g. AGE)
- Label (e.g. "Age")
- Type icon: 12 for Numeric, AB for Character
💡 Note: The Library Explorer shows the type icon for every variable (both numeric and character) - useful when scanning a long variable list. In the dataset's column headers, by contrast, only the less common case is marked (the
Nmarker; see Section 5.1). Both are intentional - full information in the variable list, minimal noise in the data view.
Code completion via Ctrl+Space: in the Variable List, hit Ctrl+Space to open a quick-search overlay listing all variables of the dataset with their labels - type to narrow down, like code completion in an IDE. Useful for browsing variables without opening the dataset first.
Right-click a variable for context actions: - Open Library - open the variable's parent library (when working with multiple libraries) - Open Attached Format - open the format attached to this variable directly from the Library Explorer, without opening the dataset first
📝 Planned: Double-click a variable to jump directly to its column in the open dataset. Not yet available.
4.2.3 Dataset View in the Workspace
Each dataset opens as a table. Column headers display: - Variable name (top) - Label (below the name) - Column markers (see chapter 5)
A collapsible SQL bar sits above the data view - see Section 6.4.
4.2.4 Rich Dataset Tooltip
Hovering over a dataset tab or its entry in the Library Explorer shows a comprehensive metadata tooltip:
Identity: - Name, Label
Size & state:
- Columns - number of variables
- Rows - number of records (when filters are active, shows filtered of total, e.g. 874 of 59 580)
- Condition - active filter expression as a SQL-style expression (e.g. LBTEST EQ "Specific Gravity")
- Order - current sort order. Variables in parentheses define the By-Group keys; variables outside the parentheses are sub-sorts within each group. Arrows: ▲ ascending, ▼ descending. Example: (▼ USUBJID, ▲ LBTESTCD), ▲ VISITNUM.
Source: - URI - file path or URL where the dataset was loaded from
CDISC / Dataset-JSON metadata (when available): - Structure, Repeating, Purpose (Tabulation / Analysis) - Created, Modified timestamps - datasetJSONVersion, fileOID, originator - studyOID, metaDataVersionOID, itemGroupOID, metaDataRef
Validation findings (when validation reports are loaded):
- Validation Findings - total count
- on Rows, on Variable - counts of affected rows / variables
- Source - validator name (e.g. pinnacle21)
- Per-finding details: Rule-Id, Severity, Kind, Message
💡 Press F2 to focus the tooltip - this allows you to select and copy text from it. The same F2 pattern works on all tooltips throughout the application.
4.3 Formats
If a Library contains formats, they appear under a FORMATS node at the top of the Library.
Naming convention:
- $NAME - character format
- NAME (no $) - numeric format
Format type indicators (icon-based):
| Icon | Type | Description |
|---|---|---|
| 📜 ✅ (with green check) | Real Mapping | Code differs from Decode - values are translated for display. e.g. $ARMCD: 1 → ACTIVE TREATMENT, 2 → PLACEBO. |
| 📜 (without check) | Identity Format | Code equals Decode - no translation, only validation of permitted values. e.g. $COLOR: green → green, yellow → yellow, red → red. |
💡 The visual distinction lets reviewers know at a glance whether a column with this format will show transformed values (Real Mapping) or pass-through values (Identity).
Hover tooltip on a format shows: - Values: number of entries - Real Mapping: Yes / No
Open a format: double-click → opens as a tab in the Workspace, displaying:
- FMTNAME - format name
- TYPE - Char or numeric
- START - the code value
- LABEL - the decoded value
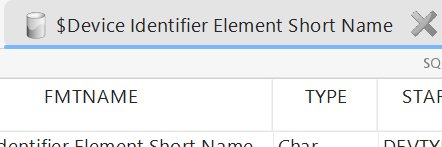
Format tabs use the grey barrel icon in the tab header - visually distinct from the colored barrel icons of dataset tabs (see Section 4.1.2).
4.4 Where Formats Come From
This is the part that surprises people, so it is worth being precise. A formatted column needs two pieces of information, and they usually live in two different files:
- Which format does this column use? - just a name, such as
$SEXorAGEGR1F. This travels in the dataset's own column metadata. - What does that name mean? - the actual
code → decodeentries, e.g.F → Female,M → Male. This comes from a format catalog, which is a separate file.
A sas7bdat or an xpt therefore does not contain its own decodes. It says "this column is formatted with $SEX" and nothing more. Without a catalog, Cumba knows the column is formatted but not what the codes stand for - the column loads without an F marker.
Where the format name comes from:
| File type | Carries a format name? |
|---|---|
SAS (sas7bdat, xpt) |
Yes - the format attached to the variable in SAS, exactly as SAS stores it |
| Parquet | Only in files written by Cumba. Parquet has no slot for a format name, so Cumba writes its own key-value block into the file. A Parquet from another tool carries none. |
| Define-XML | Yes - the variable's CodeList reference |
| Dataset-JSON · CSV · XLSX | No - values are shown as stored |
Where the mapping comes from - the two catalogs:
| Catalog | What it is |
|---|---|
sas7bcat |
A SAS format catalog. Open it alongside the data and its code → decode entries apply to every column whose format name it defines. |
| Define-XML | The codelists in a Define carry their own entries, so a Define is data description and format catalog in one. |
📝 Nothing else supplies decodes. R factors are the apparent exception and are not one:
.RDataand.rdsstore factor levels inside the file, and Cumba resolves them while loading - the cell already containsFemale, not a code plus a lookup. So there is no format, noFmarker and no Native/Formatted pair on an R factor column.
Catalogs stack - that is the point of them. When several catalogs define the same format name, the one loaded on top wins: Define-XML over sas7bcat over Cumba's built-ins. The layers below still serve every format name the top layer does not mention.
💡 This is the everyday SAS pattern, and it works in Cumba the same way: the same format name, defined differently in a different location. A study-level catalog spelling
$SEXout asF → Female / M → Malecan be laid over a global one that leaves it atF → F. You do not edit anything - you load the more specific catalog, and the columns re-decode.
A second meaning of the word "format". SAS format strings such as BEST12.2, $CHAR20. or DATE9. describe how a value is printed - width, decimals, date layout - not what a code stands for. Cumba reads and applies those too, but they are display instructions rather than codelists, and they never turn an F marker red: there is no list of permitted values to be missing from.
5. Column Markers, Tooltips & Smart Number Display
5.1 Column Markers
To minimize visual noise, Cumba shows markers only when relevant. The principle is outlier marking: only the less common property is shown as a marker. Columns without a marker are the default case.
| Marker | Meaning |
|---|---|
N (square) |
Numeric column. Columns without this marker are Character. |
F (round) |
Formatted column - a code list / format is applied. |
F (red) |
Formatted column with missing format entries - the column contains values that are not defined in the attached format. The cause is for the reviewer to decide. For Controlled Terminology codelists (non-extensible) the unmatched value is most likely a data quality issue (wrong, mis-cased, or typo'd). For extensible codelists, a sponsor-added value is also possible - but extensibility doesn't eliminate data quality issues (typos, case inconsistencies, mojibake can all occur in extended values too). Cumba flags the symptom; the interpretation is yours. |
| Filter icon - the funnel | An active filter is applied to this column. |
| ▲ / ▼ (with optional priority number, optional "ball") | Sort direction. Number = priority in multi-sort. Ball indicates By-Group sorting. |
| ⚠️ Yellow exclamation | Column has validation findings (when "Show Validation Findings" is enabled). Findings can come from any validation source - Define-XML, Cumba's built-in checks, or a Pinnacle 21 report. |
Markers can combine - e.g. a formatted numeric column shows both F and N; a filtered formatted numeric column shows F, N, and the filter icon.
💡 The funnel icon is the visual signature of Cumba: it appears in the application logo, in the toolbar, and on filtered columns.
💡 When the dataset opens, Cumba checks every column with an attached format and compares the actual values against the format's defined codes. If any value isn't in the format, the
Fmarker turns red - a quick visual cue for codelist compliance issues.📝 Planned: Hovering the
Fmarker will preview the format values inline. Not yet available.
5.2 Cell & Column Tooltips
Hovering over a cell shows a rich tooltip with three levels of information:
Cell value:
- Value - the displayed value (with ≈ prefix if rounded; see Smart Number Display)
- Exact - the full underlying value (when the displayed value is rounded)
- Formatted - the decoded value (when a format is applied)
Column metadata: - Name, Label, Type, Length, Format
Define-XML metadata (when a Define-XML is loaded): - Origin (Derived, Collected, Assigned, CRF Page reference, etc.) - Role (Identifier, Topic, Variable Qualifier, Timing, etc.) - Comment - derivation logic or notes - OrderNumber, KeySequence, Mandatory - dataType, targetDataType, itemOID
Validation findings (when present on the column): - Validation Findings - count - Per-finding details: Source · Rule-Id · Severity · Kind · Message · affected Rows
💡 Press F2 to focus the tooltip and copy text from it.
Tooltips can be globally toggled via Display → Show Tooltips.
💡 Variable tooltips work everywhere a variable appears - not only in the data view, but also in every variable-picker dialog (Find Column, Transpose, Frequency By, Merge Dataset, etc.). Hover and pause anywhere you see a variable name, and Cumba shows its full metadata.
5.3 Smart Number Display
Numeric values are rendered with extra visual cues to make data quality and floating-point behavior immediately visible.
5.3.1 Rounded Values
When a number cannot be displayed exactly (typical for floating-point arithmetic results), Cumba shows it with an ≈ prefix to indicate that the displayed value is rounded.
| Cell shows | Meaning |
|---|---|
8.55 |
Exact value |
≈8.55 |
Rounded - the actual stored value differs slightly |
5.3.2 Display vs. Exact in Tooltips
The cell tooltip shows both:
- Value - what the cell displays (e.g. ≈8.55)
- Exact - the full underlying value (e.g. 8.5499999999999999)
The displayed portion is highlighted within the exact value, giving the reviewer an instant visual bridge between what they see in the cell and what's actually stored.
💡 Why this matters: floating-point arithmetic is everywhere in clinical data, but other tools hide it. A filter
AVAL > 8.55can include or exclude apparently identical "8.55" rows depending on the hidden floating-point reality. Cumba's≈prefix and exact-value tooltip let reviewers write filters that mean what they intend.
5.3.3 Right-Aligned Consistent Decimals
Numeric columns are right-aligned with consistent decimal places so frequencies, percentages, and measured values can be compared at a glance.
💡 Example: in a Filter IN dialog, the columns
#(count) and%(share) are aligned so that even a one-row difference between groups is visually apparent (e.g. 595 F / 596 M).
5.4 Value Display Modes
When a format is applied to a column (F marker), values can be displayed in three modes:
- Native - show only the raw stored value (e.g.
0,1,54). Traditionally called Value or Code in clinical data work. - Formatted - show only the decoded label (e.g.
Placebo,<65). Traditionally called Decode. - Native and Formatted (default) - show both, with the native value in black and the formatted decode in blue
The mode applies globally and is set via Display → Table Values - see Section 6.1 for the menu structure, or the column context menu's Table Display ▶ submenu for a per-column shortcut.
💡 Display detail: For Identity formats (where Code = Decode), the value is shown in black, not blue, to avoid redundant
X - Xdisplay. TheFmarker is still shown to indicate that a format is applied.
5.5 Column Context Menu
Right-clicking on a column header opens a context menu with column-scoped actions. Many of these functions are also available in the top menu bar (Display, Columns, Sort, Filter, Tools), but the two are not identical: some actions are only in the top menu, some are only in the context menu, and most are in both. The advantage of the context menu is that it applies the action directly to the column you right-clicked on, without an extra column-selection step.
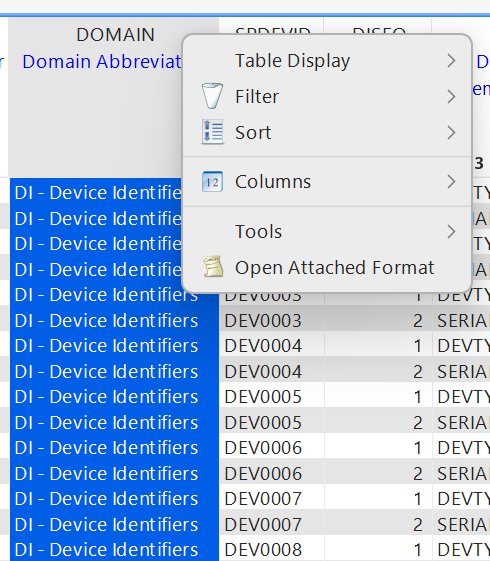
| Submenu | Purpose |
|---|---|
| Table Display ▶ | Display modes for headers, row numbers, and values (see below) |
| Filter ▶ | Filter actions scoped to this column (Filter IN, ≡, ≠, Value, Contains, Matches, Clear) - see Section 7.5 |
| Sort ▶ | Sort actions scoped to this column (Ascending, Descending, Append, By Group End, Reset, Clear) - see Section 7.4 |
| Columns ▶ | Hide / Pin / Reorder actions for this column or selection - see Section 7.3 |
| Tools ▶ | Column-scoped tools (e.g. Frequency, Descriptive, SQL Query) - see Section 9 |
| Open Attached Format | Open the format attached to this column (only available when an F marker is present) |
Table Display submenu
The Table Display submenu is the column-scoped equivalent of the global Display → Table Header / Row Numbers / Table Values settings. The currently active option in each group is marked with a blue dot.
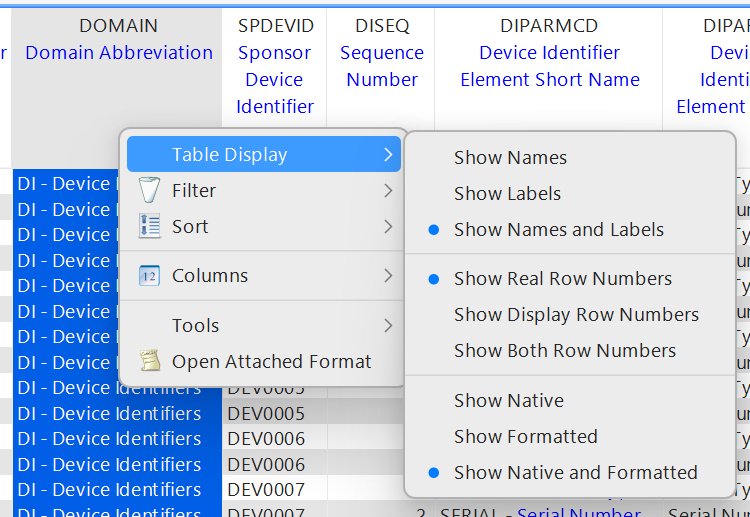
| Group | Options |
|---|---|
| Header | Show Names · Show Labels · Show Names and Labels (default) |
| Row Numbers | Show Real Row Numbers (default) · Show Display Row Numbers · Show Both Row Numbers |
| Values | Show Native · Show Formatted · Show Native and Formatted (default) |
See Section 6.1 for the meaning of each option.
💡 Why both a global menu and a context menu? The top Display menu changes the setting for all open datasets at once. The Table Display submenu in the column context menu is a quick path to the same options without leaving the data view - useful when you're focused on a single dataset and want to flip a display mode without navigating the menu bar.
Open Attached Format
For columns with an F marker (a format applied), Open Attached Format opens the underlying format as its own tab in the workspace, so you can inspect or compare its code → decode mappings without leaving the dataset.
💡 The same action is also available by right-clicking a variable in the Library Explorer - you can inspect the format without opening the dataset first.
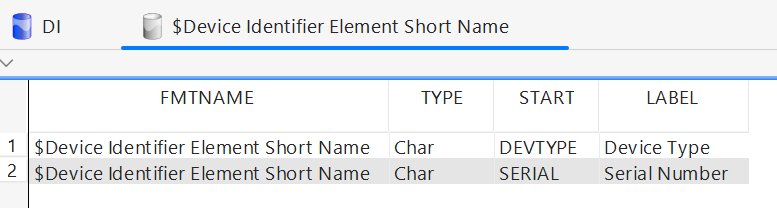
The format tab shows one row per code value, with the standard format columns:
| Column | Meaning |
|---|---|
| FMTNAME | Format name (prefixed with $ for character formats, in SAS convention) |
| TYPE | Char or Num |
| START | The native (stored) value - e.g. DEVTYPE, SERIAL |
| LABEL | The formatted decode - e.g. "Device Type", "Serial Number" |
💡 Use case: when a column shows a code you don't recognize, Open Attached Format reveals the full code list. Comparing the format with the actual data values lets you spot controlled-terminology gaps in either direction - codes defined in the format but not used in the data, or values present in the data but not defined in the format.
6. Display Options
The Display menu controls how data is rendered. Most options are global and apply to all open datasets.
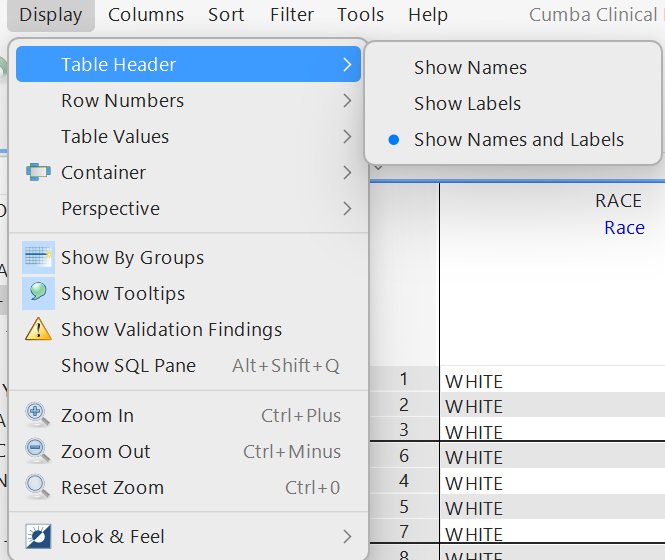
| Group | Entries | Section |
|---|---|---|
| Header & Values | Table Header ▶ · Row Numbers ▶ · Table Values ▶ | 6.1 |
| Layout | Container ▶ · Perspective ▶ | 6.2 |
| Toggles | Show By Groups · Show Tooltips · Show Validation Findings · Show SQL Pane | 6.3 |
| Zoom | Zoom In · Zoom Out · Reset Zoom | 6.5 |
| Theme | Look & Feel ▶ | 6.6 |
6.1 Header & Values
| Option | Choices |
|---|---|
| Display → Table Header | Show Names · Show Labels · Show Names and Labels (default) |
| Display → Table Values | Show Native · Show Formatted · Show Native and Formatted (default) |
| Display → Row Numbers | Show Real Row Numbers (default) · Show Display Row Numbers · Show Both Row Numbers |
Table Header - what to show in the column header:
- Name - the variable name as stored in the dataset (often cryptic, e.g. AESEV, RFXSTDTC, BMIBLGR1 - especially in CDISC/SAS data)
- Label - the human-readable description (e.g. "Adverse Event Severity", "Date/Time of First Study Treatment")
- Names and Labels (default) - show both stacked
Table Values - how to render values in formatted columns (those with an F marker):
- Native - the raw stored value (e.g. 0, 1, 54). In clinical data terminology this is also called the Value or Code.
- Formatted - the decoded label produced by the applied format (e.g. Placebo, <65). Also called the Decode.
- Native and Formatted (default) - show both, with the native value in black and the formatted decode in blue
💡 Terminology: Cumba's UI uses "Native / Formatted". The clinical data community traditionally calls the same thing "Value / Decode" or "Code / Decode". They mean the same - see Section 5.4 and the Glossary.
Row numbers explained: - Real Row Numbers - physical position in the stored dataset - Display Row Numbers - position in the current view (renumbered after sort/filter) - Both Row Numbers - shows both side by side
💡 "Real" row numbers can appear non-sequential (e.g. 1, 2, 3, 6, 7, ...) when the displayed order differs from the stored order. This is intentional - for traceability with the underlying file.
6.2 Layout
- Display → Container ▶ - placement of the active tab (Top / Bottom / Left / Right)
- Display → Perspective ▶ - preset layouts (Reset to Default / Classic (no AI) / Chat Right / Chat Bottom)
See Section 3.1 for full details.
6.3 Toggles
- Show By Groups - show horizontal separator lines between By-Group groups (also has a toolbar icon)
- Show Tooltips - globally enable/disable cell and column tooltips
- Show Validation Findings ⚠️ - highlight validation findings in yellow (errors and warnings from Define-XML, Cumba's built-in checks, or a Pinnacle 21 report). Also accessible as the yellow triangle in the toolbar.
- Show SQL Pane (
Alt+Shift+Q) - toggle the SQL bar above the dataset table
6.4 The SQL Bar
Every open dataset has a collapsed SQL bar above the data table. It is a key concept of Cumba.
Open the SQL bar (3 ways):
- Click the small triangle handle
- Drag the bar downwards - the more you pull, the taller it gets
- Alt+Shift+Q (Display → Show SQL Pane)
Close the SQL bar (2 ways):
- Click the small triangle handle
- Alt+Shift+Q again
The SQL editor lets you view and edit the SQL query underlying the current view of the dataset, with syntax highlighting and autocomplete.

The Execute button runs the edited SQL and updates the data view. OK confirms and closes the editor.
💡 Architectural note: Cumba uses an integrated SQL engine. Every UI action (filter, sort, hide column) translates to SQL behind the scenes. When a feature has no equivalent in standard SQL (e.g. the visual By-Group sort marker), the SQL bar shows a clear message ("Not expressible - …") instead of generating misleading SQL.
6.5 Zoom - Fully Scalable Interface
Cumba's entire interface scales seamlessly:
- Zoom In -
Ctrl+Plus - Zoom Out -
Ctrl+Minus - Reset Zoom -
Ctrl+0
All icons and text remain crisp at any zoom level - no pixel artifacts, no blurry icons.
💡 Useful for high-DPI displays, accessibility, presentations, and audit reviews where larger text is preferred.
6.6 Look & Feel
Display → Look & Feel ▶ provides theme options:
| Option | Icon | Meaning |
|---|---|---|
| Light | ☀️ | Bright theme - recommended default for data work |
| Dark | 🌙 | Dark theme |
| Auto | ☀️🌙 | Follows the system's day/night setting |
💡 The Auto-Mode icon - sun and moon connected with a linearity curve - was hand-drawn for Cumba.
📝 Note: Dark Mode is currently in early form. Light Mode is recommended for daily data-review work.
7. Data Exploration
7.1 Find Text in Data
Ctrl+F (Edit → Find Text) searches values across all columns of the active dataset.
📝 Planned: search will also include column labels. Currently values only.
7.2 Find Column
Ctrl+Shift+F (Columns → Find Column, also in the toolbar) - search and jump to a column by typing a fragment of either its name or its label.
CDISC datasets often use cryptic 8-character variable names (AESEV, RFXSTDTC, BMIBLGR1), while the human-readable label is what users actually remember. Find Column lets you search by either. The result list shows matching columns with both name and label; selecting a result jumps directly to that column.
💡 Tip: combine with
Ctrl+Shift+P(Pin Selected Columns) to keep a found column visible while scrolling horizontally.
7.3 Column Management
The Columns menu provides full control over which columns are visible and in what order.
| Action | Shortcut |
|---|---|
| Find Column | Ctrl+Shift+F |
| Hide / Unhide Columns (manager dialog) | Ctrl+Shift+C |
| Hide Selected Columns | Ctrl+Shift+H |
| Hide Not Selected Columns | Ctrl+Shift+K |
| Show All Columns | Ctrl+Shift+A |
| Pin Selected Columns (freeze) | Ctrl+Shift+P |
| Unpin Selected Columns | Ctrl+Shift+U |
| Unpin All Columns | – |
| Move Selected Columns | – |
| Reset Column Order | Ctrl+Shift+O |
Drag & drop column headers to reorder columns visually. Move Selected Columns does the same from the menu - useful when the target position is far off screen and dragging would mean scrolling with the mouse button held down. Select the columns, then move them as a block.
Pinning keeps columns fixed (typically on the left) while you scroll horizontally through the rest of the dataset. A vertical separator marks the boundary between pinned and scrollable columns. Sorting and selection work normally on pinned columns.
📝 Known limitation: dragging a multi-column selection currently moves only the first of the selected columns. Use Move Selected Columns for a whole block until this is fixed.
7.3.1 Hide / Unhide Columns Dialog (Ctrl+Shift+C)
A two-list dialog to manage column visibility and order in one place:
- Left list: hidden columns (with a search field for long lists)
- Right list: visible columns, in display order
Move buttons (between lists):
- « / » - move all to hidden / all to visible
- < / > - move selection to hidden / to visible
Order buttons (right side):
- ⤒ / ⤓ - move selection to top / bottom of visible list
- ↑ / ↓ - move selection up / down by one
- 🔄 - restore original (dataset) order for the currently selected columns in the visible list
💡 The
🔄button restores the original order only for the selected columns - useful when you want to bring a few columns back into their canonical order without disturbing the rest of the layout.
7.4 Sorting
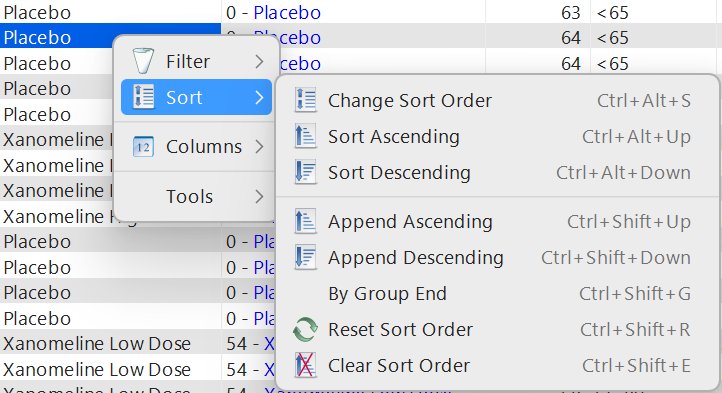
| Action | Shortcut |
|---|---|
| Sort Ascending | Ctrl+Alt+Up |
| Sort Descending | Ctrl+Alt+Down |
| Append Ascending (multi-sort) | Ctrl+Shift+Up |
| Append Descending (multi-sort) | Ctrl+Shift+Down |
| Change Sort Order (dialog) | Ctrl+Alt+S |
| By Group End | Ctrl+Shift+G |
| Reset Sort Order | Ctrl+Shift+R |
| Clear Sort Order | Ctrl+Shift+E |
Sort indicators in the column header: - 🟢 Green arrow → sorted (number = sort priority for multi-sort) - 🟢 Green arrow with circle (ball) → By-Group sorted
When By-Group is active and Display → Show By Groups is on, horizontal lines visually separate the groups.
Reset vs. Clear:
- Reset Sort Order (Ctrl+Shift+R) - restore the stored sort order defined per dataset (CDISC datasets often carry a canonical sort like USUBJID + AESEQ)
- Clear Sort Order (Ctrl+Shift+E) - remove all sorting
7.4.1 Change Sort Order Dialog (Ctrl+Alt+S)
Full control over multi-column sorting. Each entry has three options:
| Option | Description |
|---|---|
| Ascending | Sort direction (✓ = ascending, ✗ = descending) |
| Case Sensitive | Whether character sorting respects upper/lower case |
| By Group | Treat this column as a By-Group level |
Reorder/manage: ⬆️ / ⬇️ to change priority, ➕ / ➖ to add/remove, 🔄 to revert to the stored sort order.
💡 Typical pattern: set the outer column (e.g.
USUBJID) as By Group, and use the remaining columns for sub-sorting within each group.
7.5 Filtering
Filtering is a core activity. Filters are accessed via the Filter menu, the right-click context menu, the toolbar, or keyboard shortcuts.
7.5.1 Quick Filtering by Cell Value
The three most-used filters work directly on the cell under the cursor - no dialog, no menu navigation:
| Shortcut | Effect |
|---|---|
Ctrl+Alt+E |
Keep only rows where the column equals the cell value |
Ctrl+Alt+N |
Remove all rows where the column equals the cell value |
Ctrl+Alt+I |
Open a pick list to choose multiple values |
💡 Hover any cell, press the shortcut, done. With these three memorized, most everyday filtering is one keypress away.
7.5.2 All Filter Types
| Filter | Shortcut | Description |
|---|---|---|
| Filter IN | Ctrl+Alt+I |
Pick list - select multiple values to keep |
| Filter ≡ | Ctrl+Alt+E |
Equal to selected cell value(s) - select multiple cells first to filter for all of them at once |
| Filter ≠ | Ctrl+Alt+N |
Not equal to selected cell value(s) - works with multi-selection as well |
| Filter Value | Ctrl+Alt+V |
Filter by a specific single value (dialog) |
| Filter Contains | Ctrl+Alt+C |
Substring match |
| Filter Matches | Ctrl+Alt+M |
Regex pattern match (with Case insensitive and Dot matches newline options) |
| Filter Condition | – | Complex conditional logic with <, ≤, ≥, AND/OR |
💡 Filter on multiple values at once: select several cells in a column (Ctrl-click or Shift-click), then apply Filter ≡ - Cumba keeps all rows matching any of the selected values. The same works with Filter ≠ to exclude all of them in one step.
7.5.3 Context-Sensitive Filters on Numeric Cells
The right-click filter menu adapts to the column type. On numeric cells, four additional comparison filters appear with the current cell value pre-filled:
<value,≤value,≥value,>value
Example: right-clicking 69 in AGE offers AGE < 69, AGE ≤ 69, AGE ≥ 69, AGE > 69 as one-click filters.
7.5.4 Filter IN - Pick List Dialog
The Filter IN dialog (Ctrl+Alt+I) shows all unique values of the selected column with:
- A search field for long lists
- A value table with columns: Value (with decoded label if applicable) · # (count) · % (share)
- Sortable by any column
- A Negated checkbox to invert the selection
- A status bar showing total unique values and total rows
7.5.5 Filter Matches - Regex Dialog
The Filter Matches dialog (Ctrl+Alt+M) takes a regular expression with options:
- Case insensitive - ignore upper/lower case
- Dot matches newline - allow . to match line breaks
Example patterns: ^Placebo, dose$, \d{3}.
7.5.6 Edit Filter - Filter Builder
The Edit Filter dialog opens a tree-based filter builder where you can:
- Combine filters with AND / OR
- Nest filter groups
- Add a Custom Condition for free-form expressions
- Add (➕), edit, and remove (➖) individual filter nodes
7.5.7 Memorized Filters
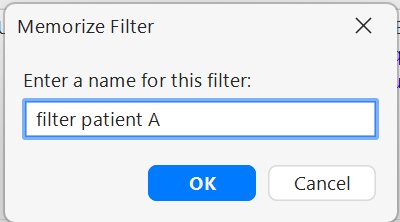
Filter sets can be saved and reused later. Useful for recurring filter patterns (e.g. "only Subject A", "only treatment-emergent AEs", "only baseline visits").
Access via the right-click context menu → Filter → Memorized Filters ▶:
- Memorize Current Filter… - save the active filter under a name
- [saved filter names] - click a saved filter to apply it
- Delete Memorized Filter ▶ - submenu to remove saved filters
Memorized filters are persistent across sessions - they remain saved after you close and restart Cumba, and are available again the next time you open the dataset.
Memorized filters are also offered across datasets: if you memorize a filter referencing a variable like USUBJID in one dataset, the same named filter appears in the Memorized Filters submenu of every other dataset that has a USUBJID column. This makes patient-centric review very efficient - define "Patient 1111" once in AE, then one-click apply it in EG, LB, VS, and every other domain that has the subject identifier.
💡 Memorized filters are particularly useful for repetitive review workflows - define your standard filter once, recall it with a click whenever you reopen the dataset.
📝 Planned: apply a memorized filter to all open datasets in a Library at once - currently it has to be applied per dataset.
7.5.8 Managing Filters
- Edit Filter - open the Filter Builder for the active filter set
- Remove Filter ▶ - submenu listing active filters individually
- Remove From Column - remove all filters on the currently selected column
- Clear Filter (
Ctrl+Alt+R) - reset all filters
7.5.9 Special Filter Menu Entries
- With Issues - keep only rows containing validation findings (yellow-highlighted). Requires loaded validation findings (Define-XML, built-in checks, Pinnacle 21). See Quality & Validation.
- Missing Format Entries - on a column with an attached format, keep only rows whose value is not defined in the format. Quick way to drill into codelist gaps after a red
Fmarker draws your attention. - Go To Row - jump directly to a specific row number (navigation, not a filter). Useful when a colleague or validator references a specific row by number.
8. Data Transformation
8.1 Merge
The Tools → Merge submenu provides both generic and CDISC-specific merge operations (also reachable via the right-click context menu on a dataset):
Generic: - Merge Dataset… - open a merge dialog to combine the active dataset with any other by user-defined key variables.
CDISC quick merges: - Merge DM - join with the Demographics dataset - Merge ADSL - join with the Subject-Level Analysis Dataset - Merge SUPP - join with Supplemental Qualifiers - Merge SUPPDM - join with Supplemental Qualifiers for Demographics - Merge RELREC - pull in the Related Records dataset, which links records across domains (e.g. an adverse event to the concomitant medication given for it)
💡 The quick merges cover the most common operations in SDTM/ADaM workflows. Standard CDISC keys (USUBJID etc.) are used automatically.
💡 RELREC is the one that is hard to do by hand: it describes relationships between records in different domains rather than adding columns from one known dataset, so the join keys differ from row to row. The quick merge resolves them for you.
After a merge, the merged-in columns are shown with a blue-tinted column header so you can visually distinguish them from columns that are native to the dataset.
8.2 Compare Datasets
Tools → Compare Datasets… - compare the active dataset against another, by structure and content.
⚠️ Compare is still under test - verify details before relying on them.
Known issue (2026-06): when the two datasets come from different storage formats, numeric columns may be falsely reported as a length change, because formats store numeric width differently. This is a comparison artefact, not a real difference - disregard numeric length-only diffs across formats until this is fixed.
Select the dataset to compare with from one of four sources (tabs):
| Source | Description |
|---|---|
| Open Datasets | Any dataset currently open in the workspace. An asterisk (e.g. ADAE *) marks a dataset with unsaved edits, so you can compare an edited version against its original. |
| Library Datasets | A dataset from an attached library. |
| Local File | A dataset file from disk. |
| URI | A dataset referenced by URI. |
Options:
| Option | Description |
|---|---|
| Match rows by key columns | When on, rows are paired up by their key values before comparing (so a reordered or partially overlapping dataset still compares correctly). When off, rows are compared position by position. |
| Key columns | The variable(s) used to match rows (e.g. USUBJID, AESEQ). Only used when Match rows by key columns is on. |
| Numeric tolerance | Numeric values count as equal when their absolute difference is within this tolerance. Useful for floating-point and rounding differences; 0 requires an exact match. |
The comparison reports differences in structure (columns, types, attributes) and in values.
Direction: the active dataset (the one you start from) is treated as the new version; you compare it against an older one. Reported changes therefore show what changed from the old to the new.
Viewing changes: differences are shown in a tooltip, in old → new form. For example:
Length: -1 → 8
Label: "Actual Treatment (NNN…" → "Actual Treatment (N)"
The result opens as its own tab (Compare: A vs B) with a summary and navigation:
| Element | Description |
|---|---|
| Summary | Counts shown top-right: equal (unchanged), modified (changed), only-in-A and only-in-B (rows present in just one dataset). |
| Show differences only | Toggle to hide all equal rows and show only the differences. |
| Previous / Next difference | Jump between the differing rows. |
Like other result tabs, the compare result behaves as a regular dataset (filter, sort, SQL).
💡 Compare against an edited version: open a dataset, make changes (it shows as
name *), then compare it against the original to see exactly what changed before exporting.
8.3 Transpose
Tools → Transpose opens the Transpose dialog to convert long-format data to wide-format. Optimized for ADaM BDS workflows.
| Field | Description |
|---|---|
| By Columns | Identifying variables that remain as keys (e.g. USUBJID, STUDYID). Multi-select. |
| Transpose Key | The variable whose values become new column names (e.g. LBTESTCD) |
| Label | Variable providing the labels for the new columns (e.g. LBTEST) |
| Primary Value | The main value to populate the new columns (e.g. LBSTRESN) |
| Secondary Values | Optional additional values (e.g. unit, flag) carried alongside |
Type icons in each field show whether the selected variable is numeric (12) or character (AB).
💡 Why transpose? BDS is the standard ADaM structure for many endpoints, but its long-format layout is not usable for graphs - charting tools expect each parameter as its own column. In BDS, parameters are stacked vertically (PARAM + AVAL); to plot Albumin vs. ALT, you need each as a separate column. Cumba's transpose bridges this gap.
8.4 SQL Query
Tools → SQL Query… (Ctrl+Alt+Q) - open the integrated SQL editor for free-form queries against loaded datasets.
Library-level SQL is also available via right-click on a Library → SQL Query….
The editor sees every open library at once. A query is not confined to one dataset or even one study - you can join ADSL from one library against a lab dataset from another, across file formats, in a single statement. Code completion proposes the libraries, datasets and columns that are actually loaded, so you do not have to remember exact spellings.
💡 Columns are decoded with their own library's formats. In a cross-library query, a column borrowed from a sibling study is not decoded through the primary study's code lists - and where Cumba cannot establish which library a column came from, it shows the raw value rather than decoding it incorrectly. A wrong decode is worse than no decode.
See also the SQL Bar for inline SQL editing per dataset.
8.5 Editing & Export
Cumba is a browser - datasets are read, not changed in place. There is no in-place save; edits are written out via Export to a new file, leaving the original untouched.
Workflow:
1. Open a dataset for editing (via the right-click context menu on the dataset).
2. Change values / rows as needed. The dataset is marked with an asterisk (name *) while it has unsaved edits.
3. Export the edited dataset to a new file (Export…). The original file is never modified.
Export Properties dialog:
| Field | Description |
|---|---|
| Pretty Print | Writes the output in a human-readable, indented form (relevant for structured formats such as XML / Define / JSON). |
| Source System Name | The originating system recorded in the exported file's metadata. Default: CumbaDataBrowser. |
| Source System Version | The version recorded alongside the source system name. Default: 1.0. |
💡 Because export always writes a new file, the source data stays intact - consistent with Cumba's principle that your data is read, never changed.
9. Analytics
9.1 Statistics
Tools → Statistics ▶ provides the four most common statistical operations in clinical data work:
| Action | Shortcut | Description |
|---|---|---|
| Create Frequency | Ctrl+Alt+F |
Frequency table (counts and percentages) for one variable |
| Create Frequency By | – | Frequency table grouped by a second variable (e.g. AESEV by TRTA) |
| Create Descriptive | Ctrl+Alt+D |
Descriptive statistics for one numeric variable |
| Create Descriptive By | – | Descriptive statistics grouped by a second variable (e.g. AGE by SEX) |
9.1.1 Descriptive Statistics Output
Tools → Statistics → Create Descriptive (Ctrl+Alt+D) computes a comprehensive table of measures per variable:
Counts: COUNT, COUNT_MISSING, COUNT_NOT_MISSING Range: MIN, MAX, RANGE, SUM Centrality: MEAN_ARITHMETIC, MEAN_GEOMETRIC, MEAN_HARMONIC, MEDIAN Quantiles: PERCENTIL_5, Q1 (25%), Q3 (75%), PERCENTIL_95 Spread: STD_DEVIATION (arithmetic/geometric × sample/population), VARIANCE (sample/population)
💡 The output is intentionally complete. Most clinical use cases only need a subset (typically N, Mean, SD, Min, Median, Max). Use
Ctrl+Shift+Hto hide unwanted columns, or the Hide/Unhide dialog (Ctrl+Shift+C) to build a custom view of the metrics you need.
9.1.2 Statistics Output as Datasets
![Statistics output as tabs - Frequency and Descriptive results open as their own datasets (e.g. Freq(DM[…]), Descr(ADAE[…]))](images/statistics_output_tabs.png)
Statistics output (Frequency / Descriptive) opens as its own tab in the Workspace, named with the source dataset and selected variables (e.g. Freq(AE[AESEV])).
💡 The result tab behaves like a regular dataset - you can filter, sort, hide columns, or even transpose it further. Statistics outputs are first-class data in Cumba.
9.2 Charts
Tools → Create Chart… opens the Select Chart Type dialog - a visual picker showing all available chart types with previews and descriptions.
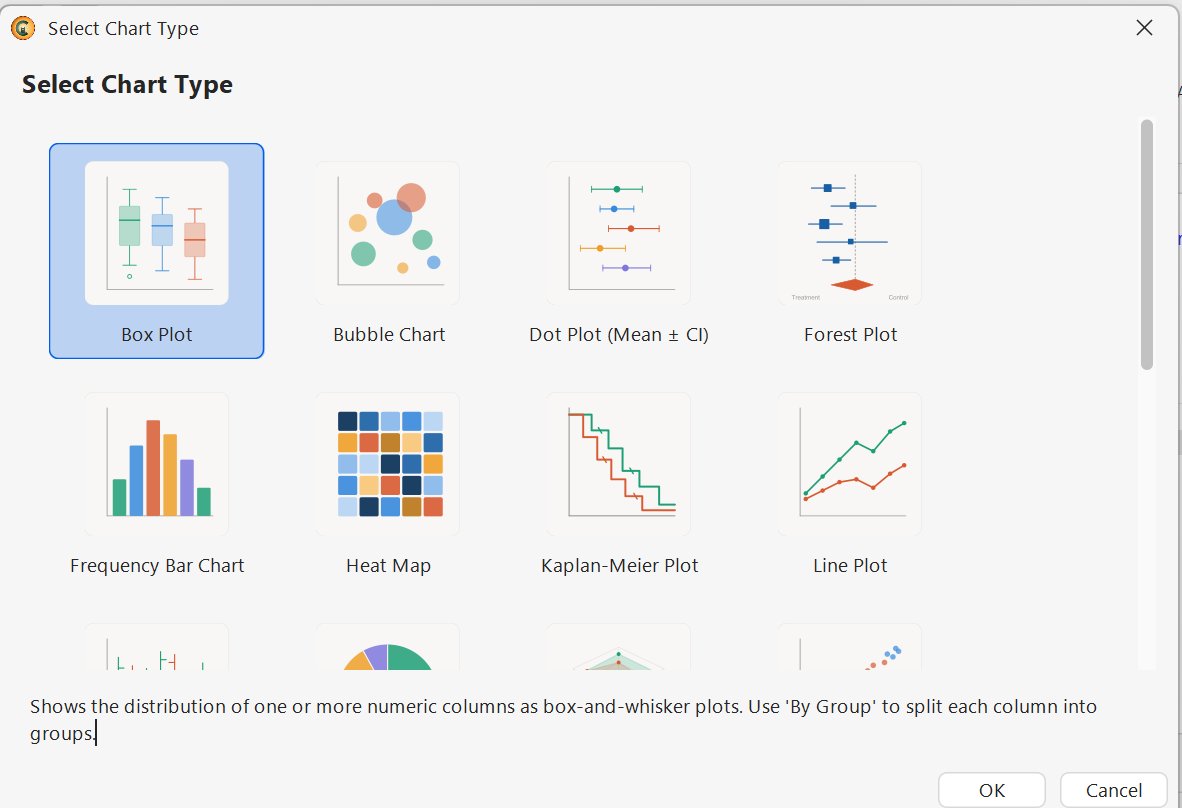
Available chart types (17):
Distribution & Comparison: - Box Plot - distribution of one or more numeric columns; "By Group" splits into subgroups - Heat Map - color-coded matrix - Frequency Bar Chart - counts per category - Pie Chart - proportions - Radar Chart - multi-dimensional comparison
Statistical Summary: - Dot Plot (Mean ± CI) - means with confidence intervals - Forest Plot - treatment vs. control with effect estimates and CI
Relationships & Correlations: - Scatter Plot - two-variable correlation - Bubble Chart - three-variable relationship (x, y, size)
Time-Course & Profiles: - Line Plot - trends over time - Spaghetti Plot - individual subject profiles over time - Shift Plot - pre/post comparison - Stick Chart - discrete event/value markers - OHLC Chart - Open/High/Low/Close-style range display
Clinical Specific: - Kaplan-Meier Plot - survival curves - Swimmer Plot - patient timelines (oncology) - Waterfall Chart - best response per patient (oncology)
💡 Cumba's chart library is heavily clinical-focused - Spaghetti, Shift, Swimmer, Waterfall, Kaplan-Meier and Forest plots are all included as built-in chart types, reducing the need for custom R/SAS scripting.
10. Quality & Validation
Cumba integrates dataset validation directly into the data exploration view. Findings are integrated into the data view and visible at every level - Library, dataset, column, row, and cell.
Supported validation sources: - Pinnacle 21 (P21) - external validator, findings loaded as a report - CoreJ - the built-in engine (see Section 11.2) - Define-XML - findings carried in the Define are read directly when the Define is loaded
10.1 Multi-Level Validation Visibility
When a Define-XML carrying findings is loaded, or an external validation report is added, findings are made visible at four levels:
| Level | Indicator |
|---|---|
| Library tree | ⚠️ next to dataset icons that have findings |
| Column headers | ⚠️ next to other column markers (N, F, sort arrow, funnel) |
| Row numbers | ⚠️ next to row numbers for affected rows |
| Cells | Yellow background highlight on affected values |
💡 This consistent multi-level marking lets you spot issues at any zoom level - from "which datasets have issues" (Library) down to "which exact cell has an issue" (cell highlighting).
10.2 Toggling Validation Highlights
The yellow highlights and column markers can be turned on/off:
- Toolbar: ⚠️ Yellow Triangle
- Menu: Display → Show Validation Findings
💡 Yellow = a finding (Warning or Error). Toggle off when you want to work without the highlights.
10.3 Validation Information in Tooltips
Hovering on a column or cell shows finding details in the tooltip:
- Source: validator name (e.g.
pinnacle21) - Rule-Id: specific rule identifier (e.g.
SD1201) - Severity: Warning / Error
- Kind: RuleViolation
- Message: human-readable description
- Rows: comma-separated list of affected row numbers (or range like
1-1000)
💡 The Rows list lets you see at a glance how widespread an issue is - 1 row vs. 30 rows vs. all rows.
10.4 Filtering to Findings Only
Filter → With Issues - keep only rows that have validation findings. Useful for systematic review.
10.5 Validation Report as a Dataset
Right-click on a Library → Show Validation Report opens the full validation findings as a dataset tab in the Workspace.
Report columns:
- domain - CDISC domain (e.g. AE, TV, QS)
- fileName - affected file
- source - validator name (e.g. pinnacle21, core)
- ruleId - exact rule identifier (e.g. SD1082, CT2002)
- severity - Warning, Error, etc.
- kind - finding type (e.g. RuleViolation)
- rule_type - additional categorization
- scope - Variable or Record level
- executability - whether the rule could be executed
- message - human-readable description
💡 Because the Validation Report is itself a dataset, you can apply all of Cumba's data tools to it: filter to Errors only, sort by Rule-ID, run Frequencies to see which rules are violated most, build charts of finding distribution, or export as CSV/Parquet/etc.
10.6 Adding a Validation Report
Right-click on a Library → Add Validation Report loads an external validation report (Pinnacle 21 or CDISC Core) and overlays its findings onto the loaded datasets.
10.7 Check Using CoreJ
Right-click any library in the Library Explorer → Check Using CoreJ… runs CoreJ validation directly.
💡 CoreJ validation is a library-level operation. Many validation rules are cross-domain (e.g. checking that every USUBJID in AE also exists in DM), which only makes sense on the full set of datasets in a library. That's why Check Using CoreJ is in the library context menu, not at the dataset level or in the global Tools menu.
Quick start: For most cases, the defaults are correct - Cumba auto-detects the CDISC Standard and Version from the loaded data. Just click OK.
Advanced configuration (for specialists):
| Field | Purpose |
|---|---|
| CDISC Standard | Standard family (sdtmig, adamig, sendig, etc.) - usually auto-detected |
| Standard Version | Specific version (e.g. 3-1 for SEND-IG 3.1) |
| TIG Use Case | Therapeutic Implementation Guide use case |
| Define-XML Version | Version of the Define-XML standard (e.g. 2.0) |
| CT Packages | Controlled Terminology packages to validate against |
| Reference Library | Optional reference library for cross-checks |
| Use Data Sets | ALL or specific datasets to include |
| Use Rules | ALL or specific rules to apply |
| Rules Directory | Custom rules folder for organization-specific validation |
| Extra Rule Files | Additional individual rule files to apply |
| Rule Worker Threads | Parallelization (default 1) |
11. Standards & Metadata
Cumba was built around the data standards used in clinical research - primarily CDISC (SDTM, ADaM, SEND) - and treats their metadata as first-class citizens rather than as side annotations.
11.1 Define-XML as a Library
A Define-XML is the metadata document that describes the structure, variables, codelists and value-level constraints of a study's submission datasets.
In Cumba a Define-XML is treated like any other library: simply open the .xml file (File → Open or drag-and-drop) and it appears as a new entry in the Library Explorer (see Section 4.1). The datasets, variables and codelists described inside become visible just like a regular library - once it is open, you would not notice from the data view that the source was a Define.
Lazy loading. When you open a Define-XML, only the definitions from the Define are listed at first (the metadata: datasets, variables, codelists). At this point Cumba does not check whether the referenced data files are actually present. Double-click an entry to open the referenced dataset - the data is loaded on demand, only when you open it. If the referenced dataset is missing, Cumba reports an error when trying to open it (the file could not be opened as a dataset).
💡 This lazy approach means a Define-XML opens instantly as a browsable metadata library, even when the actual data sits elsewhere or isn't available yet - you load each dataset only when you need it.
One caveat to be aware of: codelists in a Define-XML typically contain only the values that actually occur in the corresponding study data (this is part of the Define standard). A Define-derived format will therefore reflect the values present in this submission, not necessarily the full controlled-terminology codelist. If you need the complete codelist for analysis purposes (e.g. to display a 0 count for an unused level in a frequency table), you may want to load the original codelist source in addition to the Define.
💡 Why this matters: in many tools Define-XML is a separate "metadata viewer" disconnected from the data view. In Cumba the Define is part of the data view - a column with a codelist will show its decode whether the codelist came from a SAS catalog, a Define, or a Dataset-JSON.
11.2 Validation Engine
Cumba ships with a built-in validation engine for clinical data:
- SDTM validation runs on CoreJ, P300's own clinical rule engine, integrated directly into Cumba. Its rules are written from the CDISC, FDA and PMDA specifications.
- ADaM validation uses a separate set of rules implemented in the same engine.
The engine evaluates rules at the library level (cross-dataset checks such as referential integrity between DM, AE, EX, …) and produces findings that are surfaced through the standard mechanism described in Chapter 10: tooltips, yellow cell highlights, ⚠️ markers at every level, and the Validation Report as a dataset.
📝 Note on rules: The SDTM rule definitions used by the engine are owned by CDISC and require an appropriate license to obtain. Cumba ships the engine, not the rules.
11.3 Where Format & Codelist Information Comes From
Format and codelist information is read automatically - there is no separate "apply" step. But the format name and the format's meaning come from different places, and for SAS data they are in different files. Section 4.4 sets that out in full: which file types carry a format name, which two file types can supply the actual code → decode mapping, and how catalogs stack when more than one defines the same name.
12. Integrations
12.1 AI Agent
Tools → AI Chat (Ctrl+Alt+A) opens the AI Agent as a tab in the Workspace.
📝 The feature is called the AI Agent. The menu entry, the options tab and the dialog title still read “AI Chat” and “AI Assistant” - this manual quotes the labels as they appear on screen. The AI can both answer questions about your data/the tool and execute actions directly (filter, sort, transform, etc.).
12.1.1 What the Agent Can and Cannot Do
The Agent works through a fixed set of tools. The boundary is deliberate and worth stating plainly:
The Agent reads, filters, sorts, analyses and opens. It never writes.
| It can | It cannot |
|---|---|
| Inspect schema, dimensions and sample data | Convert data (Tools → Convert Data…) |
| Open and close datasets; list libraries and their members | Export to a file |
| Set, remember, re-apply and clear filters | Edit values, add rows or columns, mark rows deleted |
| Sort, hide/show columns, pin columns, set by-group | Create, rename or remove libraries |
| Build frequency and descriptive statistics, charts and SQL results | Run Define-XML conformance checks |
| Transpose, compare and merge datasets (including SUPP-- and SUPPDM) | Change the window layout, zoom or split regions |
| Run CoreJ validation and read the resulting findings |
There is no tool that writes a file or alters source data. An Agent-built result - a frequency table, a chart, a SQL result - is a new view in the Workspace, exactly like the same result built by hand from the menus. Your data on disk is never touched.
12.1.2 Multi-Provider Support
The AI Agent supports multiple AI providers (configurable by clicking the menu icon in the AI pane header). Choose the provider and model that best matches your organization's compliance requirements, performance needs, and cost preferences.
12.1.3 Configuration
Open the AI Agent Options dialog by clicking the menu icon (three horizontal lines) in the AI Agent pane header.
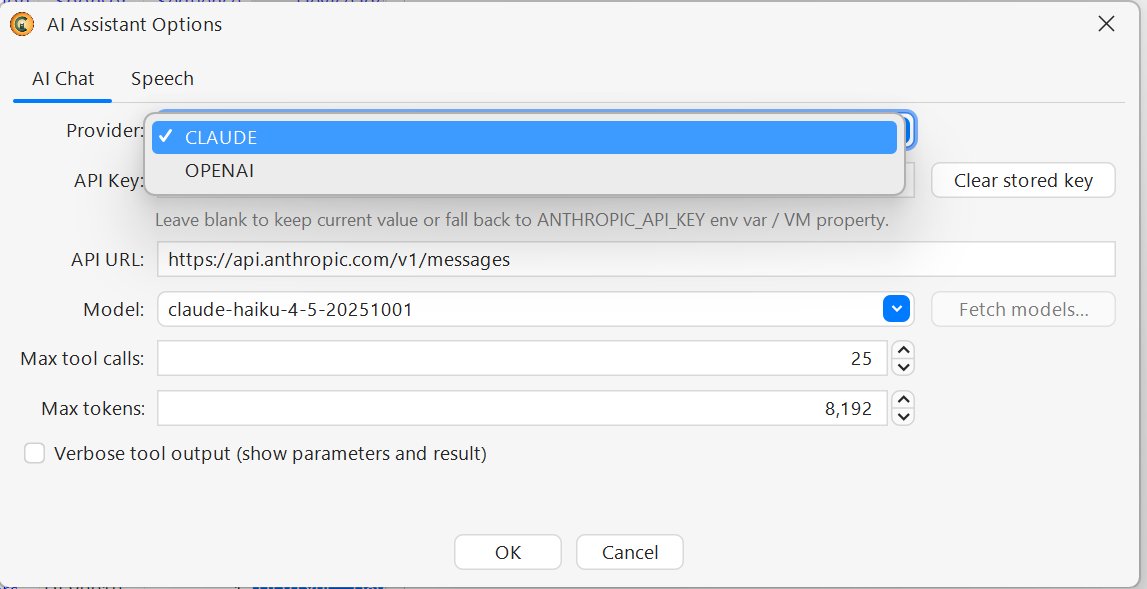
The dialog has two tabs (AI Chat and Speech). Configure the AI Chat tab as follows:
| Setting | Description |
|---|---|
| Provider | Select your LLM provider - currently CLAUDE (Anthropic) and OPENAI are supported |
| API Key | Paste your API key (stored securely). Clear stored key removes the saved key. |
| API URL | Endpoint for the selected provider (editable for self-hosted or proxied instances) |
| Model | Specific model to use; click "Fetch models…" to retrieve the current list from the provider |
| Max tool calls | Limit on how many tool invocations per response (default: 25) |
| Max tokens | Maximum length of each AI response (default: 8,192) |
| Verbose tool output | When enabled, shows tool parameters and results inline |
💡 On the API Key field: leave it blank to keep the previously stored value, or to fall back to the
ANTHROPIC_API_KEYenvironment variable / JVM system property.
API key sources (in order of priority):
1. UI dialog (recommended)
2. Environment variable (e.g. ANTHROPIC_API_KEY)
3. JVM system property
Speech tab: A second tab in the Options dialog configures speech-to-text and text-to-speech features (details to be documented).
12.1.4 Tab Integration
The AI Agent lives in a regular Workspace tab, so you can use Cumba's split-pane system to keep your data visible on the left while the AI is on the right (drag the AI tab to the side to split the view).
The status bar shows current token usage for the conversation, so you can track API costs.
12.2 Open Study Builder
Cumba integrates with the open-source Open Study Builder (OSB) - a system for managing study definitions and standards. Through the integration, Cumba can display OSB content directly:
- Study definitions stored in OSB
- Metadata for variables and datasets
- Standard definitions (controlled terminology, codelists, etc.)
- Other OSB-resident content
This lets reviewers inspect what's in OSB - including how a study is defined, which terminologies are referenced, and what the standards prescribe - without leaving the Cumba data browser.
(Detailed documentation to follow.)
13. Tips & Shortcuts
13.1 Keyboard Reference
File:
- Ctrl+W - Close View
- Ctrl+Alt+C - Remove Library
- Alt+F4 - Exit
Edit:
- Ctrl+Z / Ctrl+Y - Undo / Redo
- Ctrl+F - Find Text in data
Display:
- Alt+Shift+Q - Toggle SQL Pane
- Ctrl+Plus / Ctrl+Minus / Ctrl+0 - Zoom In / Out / Reset
Columns:
- Ctrl+Shift+F - Find Column (by name or label)
- Ctrl+Shift+C - Hide / Unhide manager
- Ctrl+Shift+H / K / A - Hide Selected / Hide Not Selected / Show All
- Ctrl+Shift+P / U - Pin / Unpin Selected
- Ctrl+Shift+O - Reset Column Order
Sort:
- Ctrl+Alt+S - Change Sort Order dialog
- Ctrl+Alt+Up / Down - Sort Ascending / Descending
- Ctrl+Shift+Up / Down - Append Ascending / Descending
- Ctrl+Shift+G - By Group End
- Ctrl+Shift+R / E - Reset / Clear Sort Order
Filter:
- Ctrl+Alt+I - Filter IN (pick list)
- Ctrl+Alt+E - Filter ≡ (equal to cell value)
- Ctrl+Alt+N - Filter ≠ (not equal to cell value)
- Ctrl+Alt+V - Filter Value
- Ctrl+Alt+C - Filter Contains
- Ctrl+Alt+M - Filter Matches (regex)
- Ctrl+Alt+R - Clear Filter
Tools:
- Ctrl+Alt+Q - SQL Query
- Ctrl+Alt+A - AI Chat
- Ctrl+Alt+F - Create Frequency
- Ctrl+Alt+D - Create Descriptive
Tooltips:
- F2 - Focus the current tooltip (allows text selection / copy)
13.2 Power User Patterns
- Quick filter on a value: hover the cell →
Ctrl+Alt+E(keep) orCtrl+Alt+N(exclude) - Find a column you barely remember:
Ctrl+Shift+F, type any fragment of name or label - Lock subject ID in view while scrolling wide: find USUBJID →
Ctrl+Shift+P - Get back to the canonical sort:
Ctrl+Shift+R - Inspect dataset metadata + validation status: hover the dataset tab (or library entry)
- Edit the underlying SQL: drag the SQL bar down, click the triangle handle, or
Alt+Shift+Q - Side-by-side compare: drag a dataset tab to the right edge → splits the workspace
- AI alongside data: open AI Chat → drag its tab to the side
- Zoom for presentations / accessibility:
Ctrl+Plusto enlarge - the interface scales seamlessly
14. Help & Feedback
The Help menu provides:
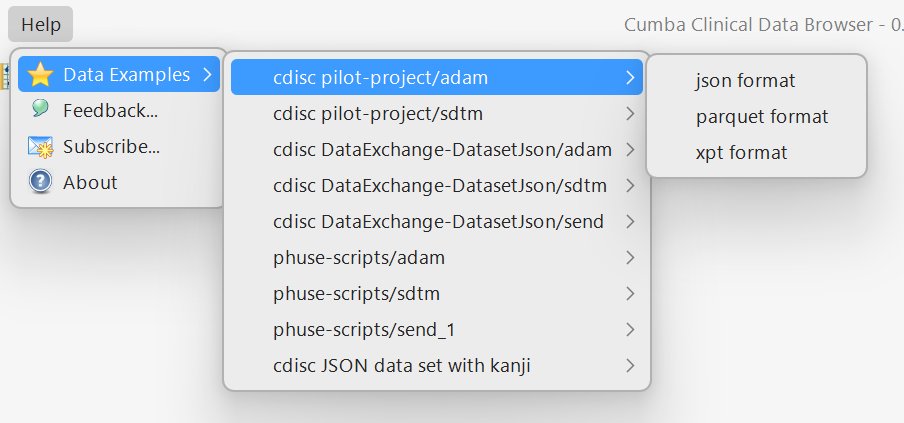
- Data Examples ▶ - submenu offering CDISC and PHUSE sample datasets to download and load. Includes:
- cdisc pilot-project (ADaM, SDTM) - in JSON, Parquet and XPT formats
- cdisc DataExchange-DatasetJson (ADaM, SDTM, SEND)
- phuse-scripts (ADaM, SDTM, SEND)
- cdisc JSON dataset with kanji - useful for testing UTF-8 handling
- Feedback… - send feedback directly from the application
- Subscribe… - subscribe for updates and announcements
- About - version, build, hash, timestamp, contact, and license information for embedded libraries
15. Troubleshooting
15.1 Data Loading
A file won't load. - Check the file format is one of the supported types (see Section 2.1). - For non-standard CSV/Excel files (uncommon delimiters, multiple sheets, special encodings), use right-click on the dataset → Open With Properties… to specify reader options manually. - For files from URLs, ensure the URL is directly accessible (no redirects, no authentication wall).
Character data shows wrong characters (mojibake / question marks). - The file is likely not UTF-8 encoded. Try Open With Properties… to specify the encoding (e.g. Latin-1, Windows-1252). - Cumba is fully UTF-8 compatible - once the source encoding is correctly specified, CJK and accented characters display correctly.
Performance is slow with a large library.
- Try right-click on the library → Lock In Memory to keep the datasets in RAM.
- Hide unused columns (Ctrl+Shift+H) - fewer rendered columns improves scrolling.
- Close unused dataset tabs.
15.2 Display
Validation findings (yellow highlights) are not shown.
- Make sure the ⚠️ toolbar button is enabled, or Display → Show Validation Findings is checked.
- Validation findings only appear when a Define-XML carrying findings is loaded, or an external validation report (Pinnacle 21) has been added.
Tooltips don't appear on hover.
- Check Display → Show Tooltips is enabled.
- If tooltips appear but disappear too fast, press F2 while the tooltip is visible to focus and pin it.
Row numbers look non-sequential (1, 2, 3, 6, 7, 12, …).
- This is intentional - you are viewing Real Row Numbers (the physical position in the stored file). After sort/filter, these numbers reflect the original positions, not the display order.
- To see the display order instead, switch to Display → Row Numbers → Show Display Row Numbers or Show Both Row Numbers.
Columns are not in the order I expected.
- Use Ctrl+Shift+O to reset to the original (stored) column order.
- For partial reset, select columns in the Hide/Unhide dialog and use the 🔄 button to restore their original positions.
15.3 Filters & Sort
A filter shows fewer rows than expected (e.g. AVAL > 8.55 excludes some "8.55" rows).
- This is a floating-point display rounding effect. Hover the cell to see the Exact value in the tooltip - values displayed as ≈8.55 may actually be 8.5499… (just below the threshold).
- See Smart Number Display.
Reset Sort Order doesn't go back to the order I expected.
- Ctrl+Shift+R restores the stored sort order defined in the dataset (e.g. CDISC datasets often carry a canonical USUBJID + AESEQ order). To clear sorting entirely instead, use Ctrl+Shift+E (Clear Sort Order).
A memorized filter doesn't seem to apply. - Memorized filters apply only to the current dataset. Make sure you're applying it to the dataset where the variables exist.
15.4 AI Agent
The AI Agent pane shows "API key not configured".
- Click the menu icon (☰) at the top of the AI Agent pane to open the configuration dialog.
- Choose a provider, paste your API key, and confirm.
- Power users can also set the key via environment variable (e.g. ANTHROPIC_API_KEY) or JVM system property - restart Cumba afterwards.
The AI doesn't seem to know about my data. - The AI sees only what is currently open in the Workspace. Open the relevant dataset before asking questions about it. - Some questions may need the AI to call tools (Filter, Statistics, etc.) - check that Verbose tool output is enabled in the AI options if you want to see what the AI is doing.
15.5 Validation
Check Using CoreJ… is not in the Tools menu.
- This is by design. CoreJ validation operates at the library level (many rules are cross-domain). Right-click on the library in the Library Explorer to find it.
- See Section 10.7.
The validation finding shows on a column, but the values look fine. - Some findings are scoped to the column or the dataset, not to individual cells (e.g. "Variable length too long" applies to the column definition, not to any single value). The tooltip on the column or its yellow marker shows the rule's actual scope.
15.6 General
I can't find a function I expected to exist.
- Cumba relies heavily on right-click context menus. Try right-clicking on cells, columns, datasets, or libraries - many functions live there and not in the top menu bar.
- Use Ctrl+Shift+F to search columns by name or label.
- Use Ctrl+F to search for values in the data.
An error dialog appeared out of nowhere. - That is intentional. Failures that used to die quietly in a log file now surface to you - including failures that happen before the main window is even up, which are held back and shown as soon as it appears. Seeing the message is better than wondering why something silently did not work. - The text of the message plus the build info from About is what makes a report useful.
Loading a large SAS file behaves differently than it used to.
- sas7bdat files are read in parallel and memory-mapped by default. Row order and values are byte-identical to the older sequential reader - only the speed and the memory profile change.
- If you ever need the old behaviour (to rule the loader out while chasing a bug), start Cumba with -Dbdat.parallel=false or -Dbdat.mmap=false.
Something else broken or unclear?
- Check the About dialog for the build/hash of your version, and contact info@p-300.com with a description and the build info.
Appendix A. Glossary
Cumba UI concepts
- Library - a top-level container in the Library Explorer that holds datasets and formats. A library can be backed by a folder of files (SAS, Parquet, JSON, CSV, …), a single Define-XML, or a single file.
- Library Explorer - the left-hand pane of the application; lists all open libraries with their datasets and formats.
- Workspace - the right-hand area; contains the open dataset, format and analysis tabs.
- Pane / Region - a sub-area of the Workspace that holds one or more tabs. Panes are created by splitting the Workspace (
Split Right / Left / Above / Below) and can be maximized, closed, or merged again. - Tab - an opened item (dataset, format, analysis result, AI Agent) inside the Workspace.
- F marker - a small
Ficon next to a column name indicating that a format is applied to that column. - N marker - indicator that a column is numeric.
- Memorized Filter - a filter saved under a name on a dataset. Persists across application restarts.
- SQL Bar - the collapsed bar above each opened dataset that expands to a full SQL editor showing the query underlying the current view.
- Display Row Number - the row's position in the current view (after sort/filter); changes as the view changes.
- Real Row Number - the row's physical position in the stored dataset; stable regardless of view.
- Native value - the raw stored value of a cell. In clinical-data terminology this is also called the Value or Code.
- Formatted value - the decoded label produced by an applied format. Also called the Decode.
- By-Group sort - a sort that defines visual groups, indicated by a "ball" on the sort arrow and (optionally) horizontal separator lines in the data view.
- Outlier marking - Cumba design principle: only the less common property of a column is marked (e.g. only numeric columns get an
Nmarker, not character columns). The default case is unmarked. - Identity Format - a format where each code equals its decode; used to define an allowed value domain without translation.
- Real Mapping Format - a format where codes differ from decodes; used to translate stored codes into human-readable display values.
Clinical data standards
- ADaM - Analysis Data Model (CDISC standard for analysis datasets).
- ADSL - Subject-Level Analysis Dataset; one row per subject.
- BDS - Basic Data Structure; long-format ADaM convention.
- CDISC - Clinical Data Interchange Standards Consortium.
- CoreJ - P300's clinical rule engine. It powers Cumba's built-in SDTM and ADaM validation and is also available as a product of its own. Its rules are written from the CDISC, FDA and PMDA specifications.
- Codelist - a controlled set of allowed values for a variable.
- CT - Controlled Terminology; the maintained set of codelists used in CDISC standards.
- Dataset - a structured set of records loaded from a file (e.g.
DM,AE,LB). Cumba keeps dataset and table apart on purpose: a dataset is data, a table is a result - a Frequency, a Descriptive, a Compare. Both open as tabs and both behave like data, but the words are not interchangeable. - Dataset-JSON - CDISC's JSON-based dataset interchange format; structurally similar to Define-XML's data layer.
- Define-XML - CDISC metadata standard describing datasets, variables and codelists.
- Domain - in SDTM, a thematic grouping of observations (e.g.
AEadverse events,LBlab tests,VSvital signs). - Format - a code-to-decode mapping (see Identity Format / Real Mapping Format).
- P21 (Pinnacle 21) - industry-standard validator for SDTM/ADaM datasets. Findings can be loaded into Cumba.
- SDTM - Study Data Tabulation Model; CDISC standard for tabulation datasets.
- SEND - Standard for Exchange of Nonclinical Data; structurally based on SDTM but for animal study data.
- SUPP-- - Supplemental Qualifiers (e.g.
SUPPAE,SUPPDM). Hold variables that don't fit in the main domain. - TIG Use Case - Therapeutic Implementation Guide use case; a CDISC-defined therapeutic-area-specific scenario for validation.
- USUBJID - Unique Subject Identifier across the study.
File formats
- Parquet - columnar binary file format with a typed schema; supports dictionary encoding which Cumba reads as format information.
- RData / RDS - R data formats.
.RData(short form.rda) stores one or more named objects;.rdsstores a single object. R factors in both are recognized by Cumba as formats. - sas7bdat - native SAS dataset file.
- sas7bcat - native SAS format catalog file; holds code/decode mappings referenced by
sas7bdatfiles. - XPT / XPT v5 - SAS Transport file format; the SDTM submission file format for older standards.
End of Manual v0.5