Cumba Data Browser - User Guide
Workflow-oriented companion to the User Manual
Version 1.0
💡 This guide answers "How do I do X?" - step by step, with the keyboard shortcuts you'll actually use. For a feature reference, see the User Manual.
Workflow 1: Explore Adverse Events
You're handed an SDTM library and asked: "Have a look at the adverse events - anything interesting?" This is the everyday Cumba workflow that touches almost every feature: open, find, filter, merge, pin, save, and inspect.
We'll walk through both ways: the curious way (full exploration) and the lazy way (one-shortcut shortcut at the end).
1. Open the dataset
Drag the SDTM folder onto the application - or File → Open Library…. Cumba uses the folder name as the library's default name and asks for an optional label (e.g. study identifier or description). The library appears in the Library Explorer on the left, shown as <Name> - <Label>, with all domains listed below.
Double-click AE (Adverse Events) - it opens as a tab in the Workspace.
💡 The library shows its name in dark and its label in blue - the same visual convention used for datasets and variables. Consistent across all three levels.
💡 Cumba shows the green Parquet tonne for Parquet data, blue for SAS, purple for JSON. At a glance you know what kind of data you're looking at.
2. Find the column you need
You want adverse event severity, but is the variable called AESEV, AESEVN, or AESEVERITY in this SDTM version?
Press Ctrl+Shift+F to open Find Column. Type severity - Cumba searches both names and labels and jumps to AESEV ("Severity/Intensity").
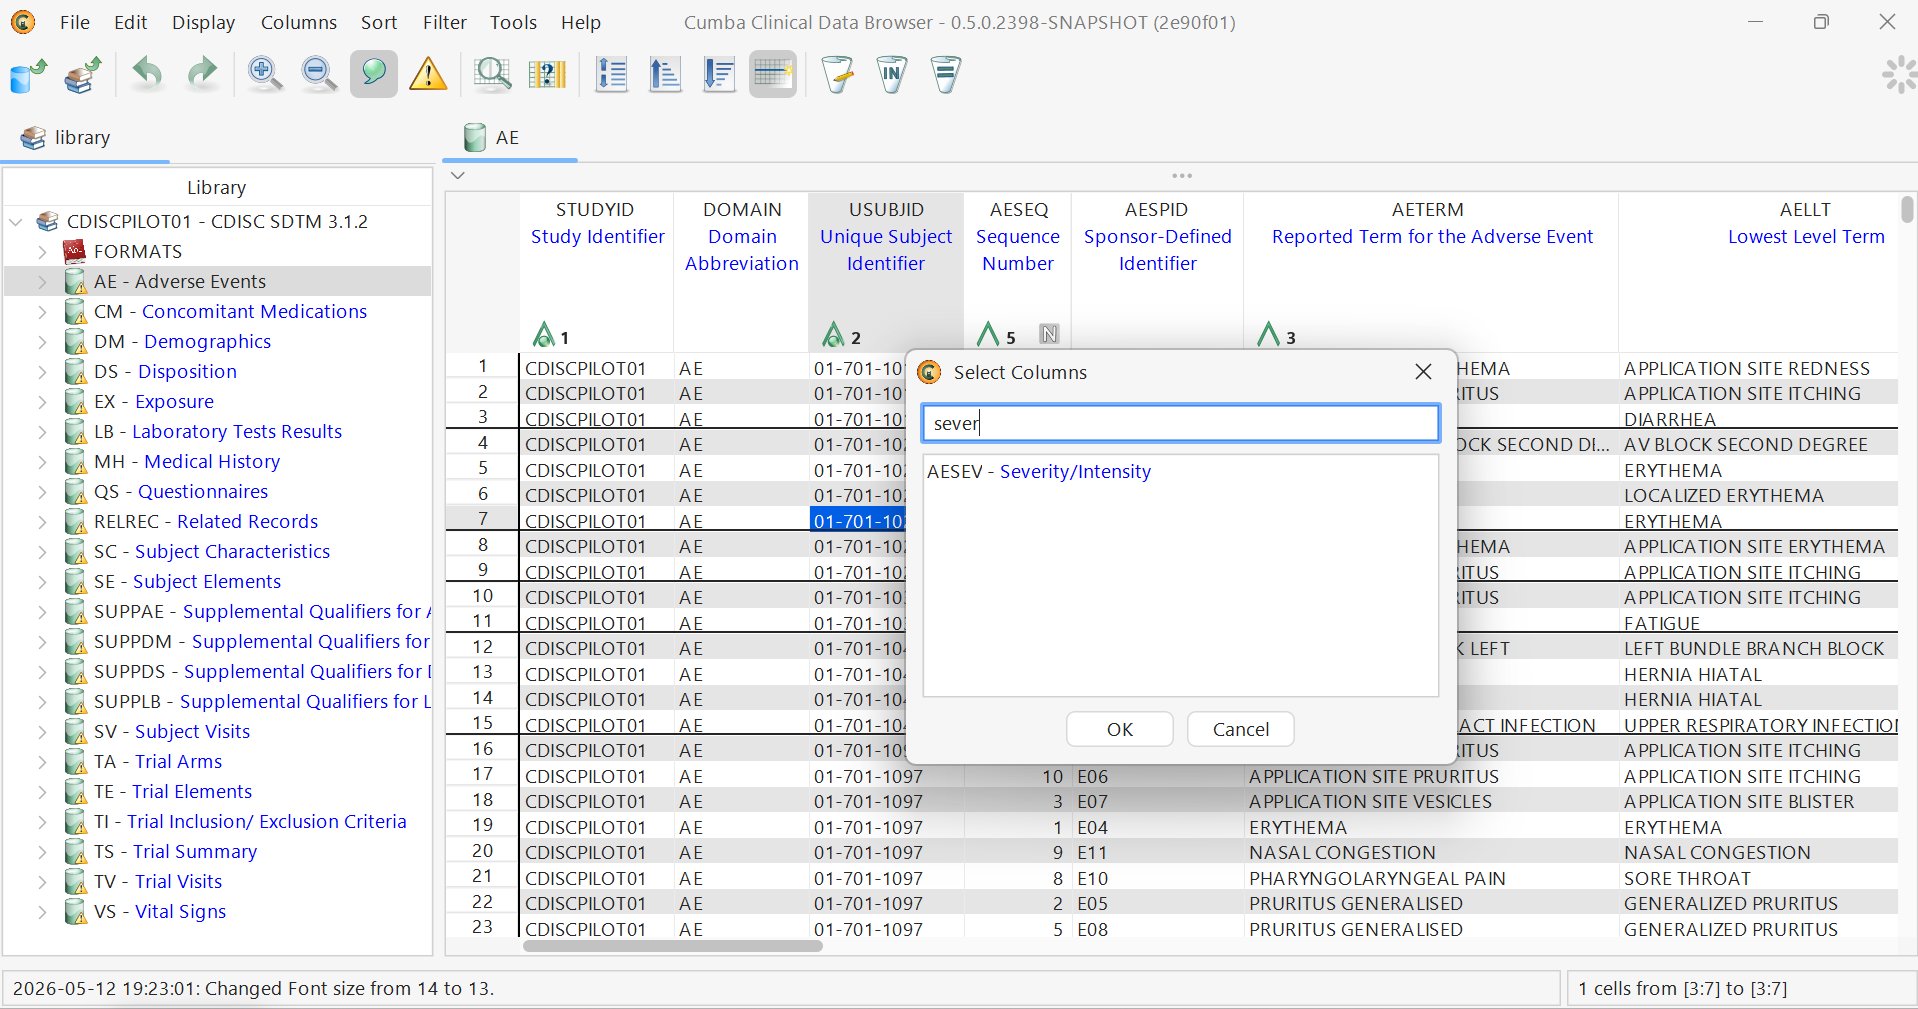
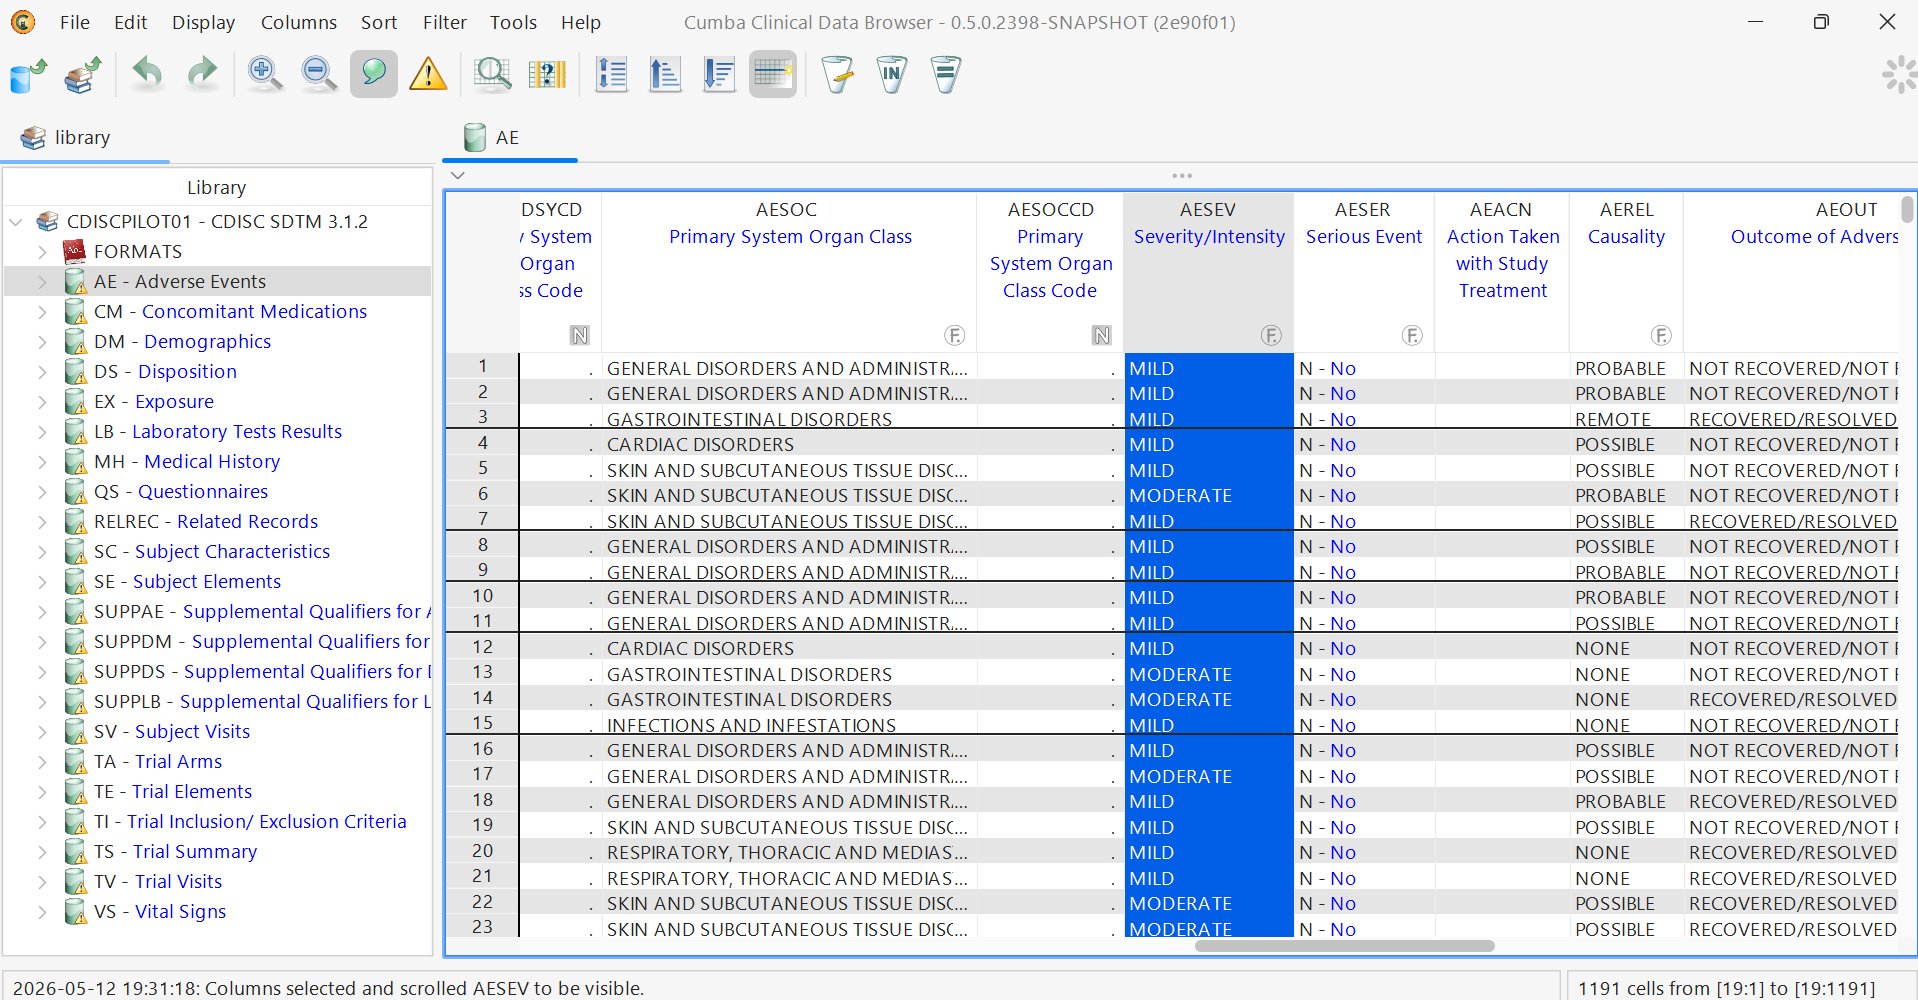
After pressing Enter (or clicking OK), Cumba scrolls to the column and selects it - so you immediately see what you're working on.
3. Look at what's in the column
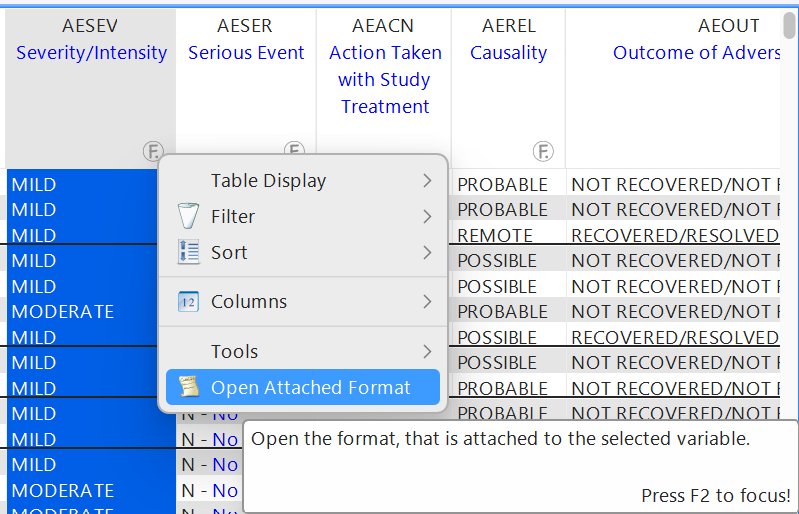
The column has an F marker - a format is applied. Right-click the column header → Open Attached Format. A new tab opens showing the code-decode mapping: MILD, MODERATE, SEVERE.
A new tab opens - $SEV - with the format's code-decode entries:
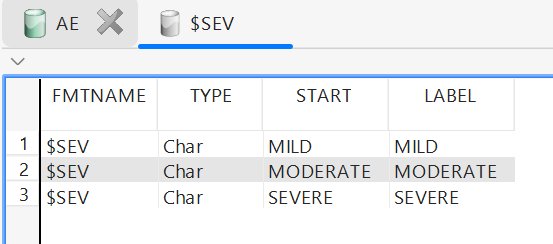
You now know the allowed values without having to scroll through thousands of rows.
💡 In this case the format is an Identity mapping - code equals decode (MILD → MILD). That's why values in the data view appear in plain black, not the blue Code-Decode pair you'd see for a Real Mapping format like
1 → Placebo.💡 If any actual value in a formatted column doesn't match its codelist, Cumba marks the
Fmarker red - and offers a "Missing Format Entries" filter to jump straight to the offending rows. A quick visual check for either codelist gaps (legitimate value missing from the format) or data quality issues (wrong, mis-cased, or typo'd values). (Walkthrough with screenshots to follow.)
4. Inspect the variable metadata
Hover the AESEV column header (or a cell in it) and pause for a moment - Cumba shows a metadata tooltip with everything the dataset knows about the variable.
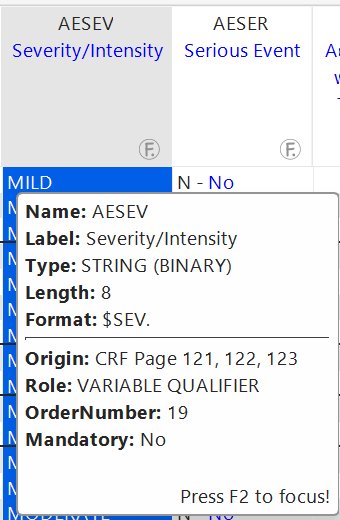
What you get at a glance: - Name, Label, Type, Length, Format - the variable's structural definition - Origin - where the data came from (e.g. CRF Page numbers) - Role - its CDISC role (Topic, Qualifier, Timing, …) - OrderNumber and Mandatory - submission metadata
🦉 Press F2 to focus the tooltip - useful when the values are long and you want to copy or scroll inside it.
5. Sort by severity (descending, severe first)
Right-click the AESEV column → Sort → Sort Descending. The arrow turns green and points down. Severe events are now at the top.
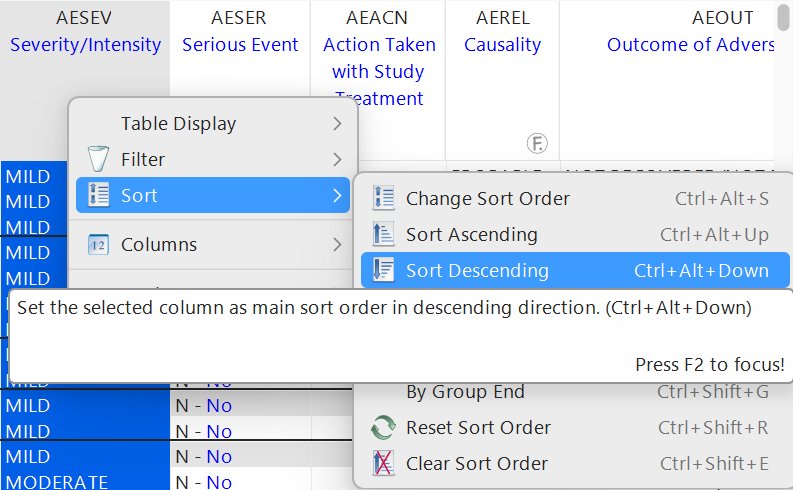
💡 Like most actions in Cumba, sorting works through four entry points: the right-click context menu, the top Sort menu, the toolbar (sort icons), or the keyboard shortcut (
Ctrl+Alt+Downfor descending,Ctrl+Alt+Upfor ascending). Pick whichever is closest to your mouse.
6. Filter to "SEVERE" only
There are two ways:
Curious way:
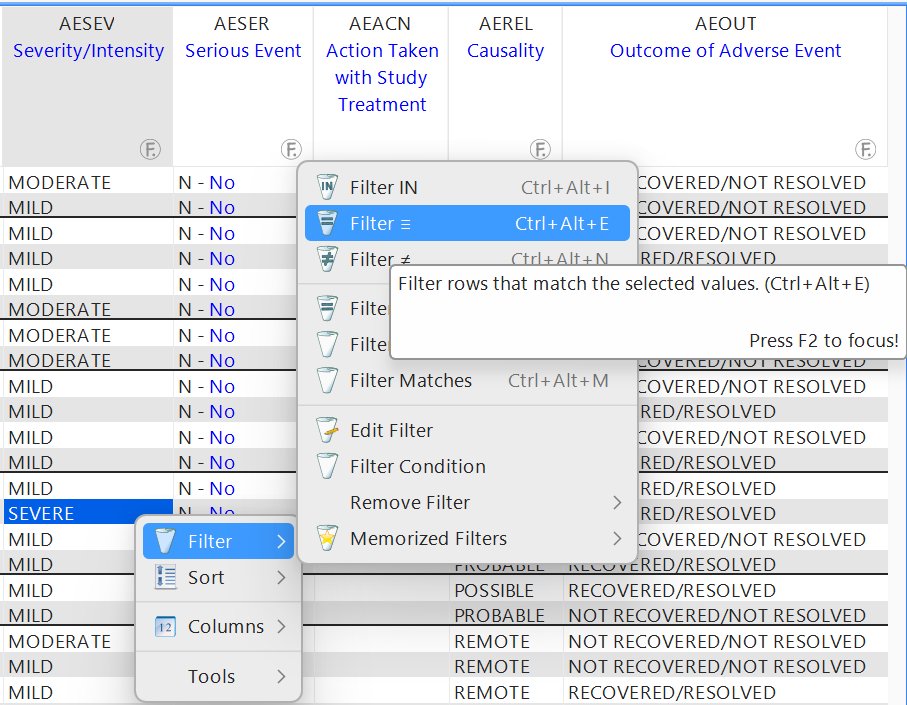
- Right-click any cell containing SEVERE → Filter → Filter ≡
- (Or hit Ctrl+Alt+E directly on the selected cell)
Multiple values at once:
- Ctrl-click two or more cells (e.g. MODERATE and SEVERE)
- Then Ctrl+Alt+E - Cumba keeps all rows matching any of the selected values
A funnel icon appears in the column header. The row count at the bottom drops.
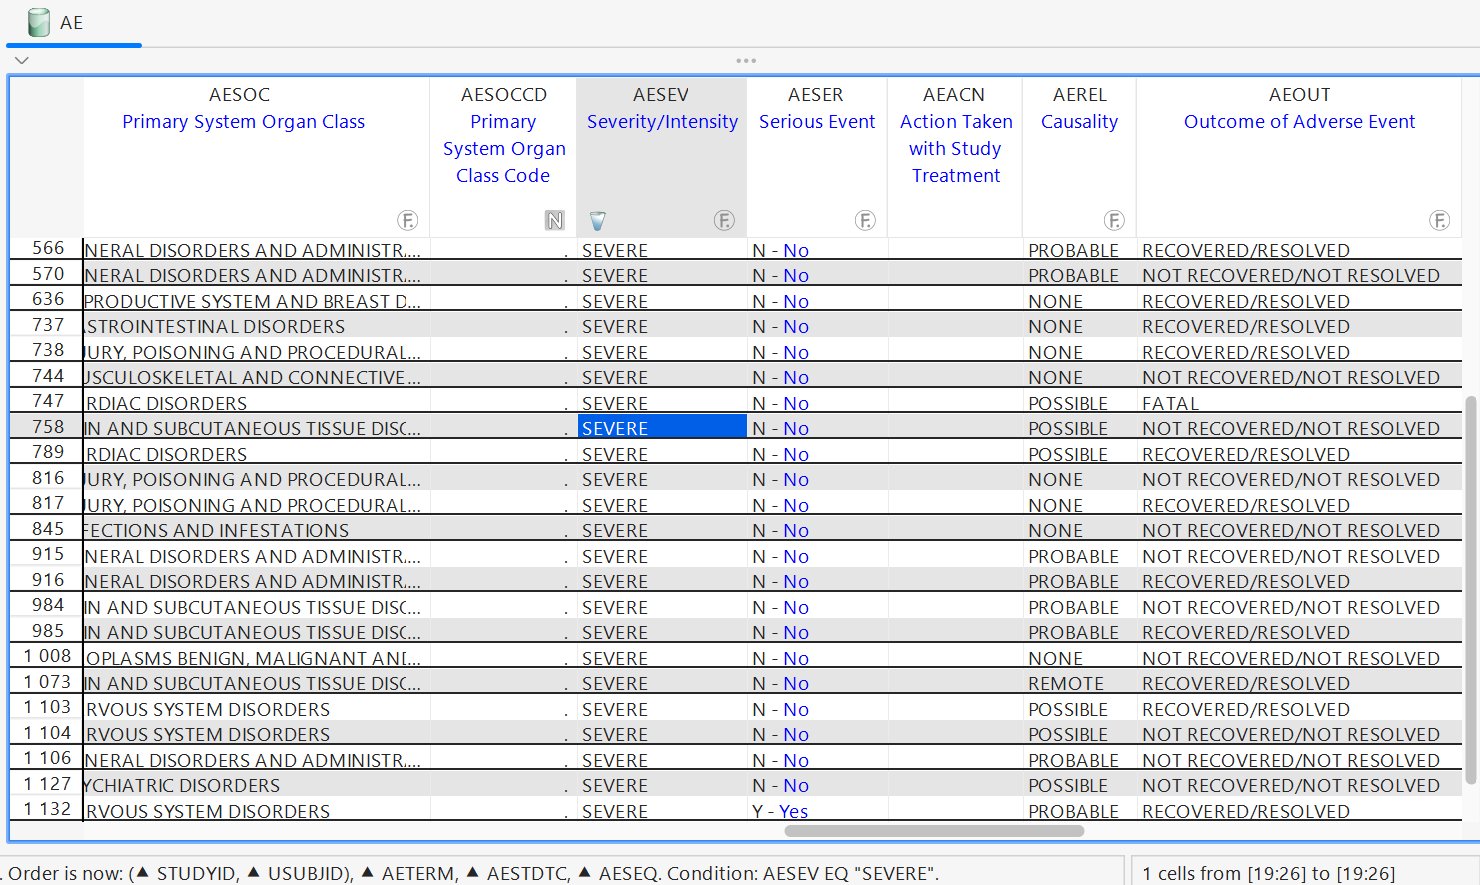
💡 Check the status bar at the bottom - it always shows the current sort order and filter condition in plain text (e.g.
Condition: AESEV EQ "SEVERE"). Quick way to verify what you've applied without opening the SQL pane.
7. Inspect the SQL
Cumba has been building a SQL query behind the scenes - every sort and filter action you took is reflected there. Worth a peek now while it's still simple.
Open the SQL bar - click its small triangle handle (or drag the bar down, or Alt+Shift+Q). The editor opens:
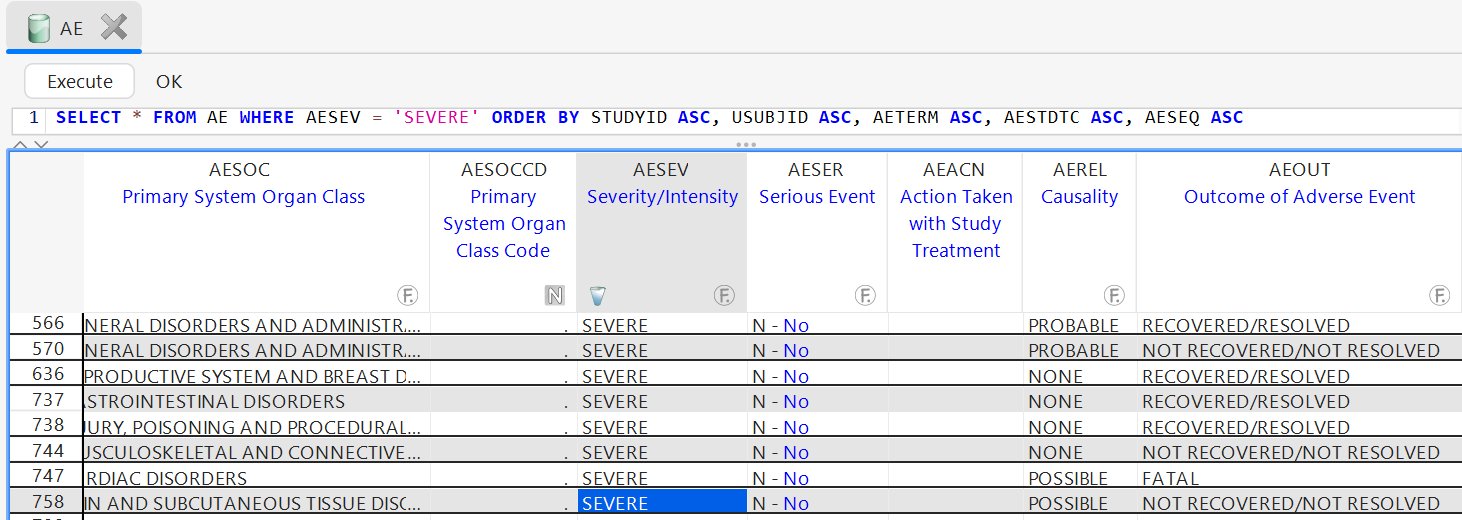
SELECT * FROM AE
WHERE AESEV = 'SEVERE'
ORDER BY STUDYID ASC, USUBJID ASC, AETERM ASC, AESTDTC ASC, AESEQ ASC
Copy it, paste it into SAS or any other SQL engine - same query, same result.
💡 Two-way binding: edit the SQL, hit Execute, and the data view updates accordingly. Every UI action you take is reflected here; every SQL edit you make is reflected back in the UI.
💡 Close the SQL bar with the same triangle handle, or
Alt+Shift+Qagain.
8. Get a quick frequency
Before you check the frequency, remove the filter so you see counts for all severities, not just SEVERE. Right-click the AESEV column → Filter → Remove Filter (or click the funnel icon in the column header).
How many of each severity are there? Don't write SAS for that.
Select the AESEV column header. Then Tools → Statistics → Create Frequency (or Ctrl+Alt+F).
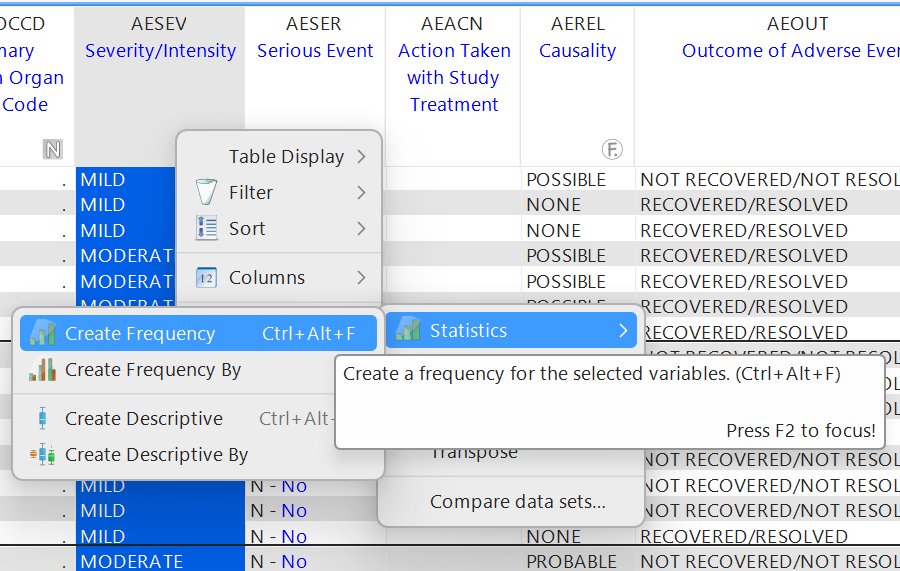
A new tab opens - Freq(AE[AESEV]) - with one row per category and the count and percent:
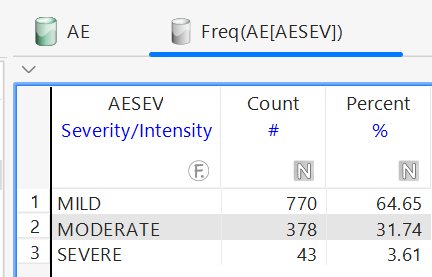
Useful, but you want to know whether one treatment arm produces more severe events than another. You'd need Tools → Statistics → Create Frequency By with TRTA as the grouping variable - but TRTA isn't in AE. Treatment arm lives in DM (or ADSL for ADaM).
That's the perfect motivation for the next step.
9. Merge in patient demographics
Tools → Merge → Merge DM - Cumba joins the Demographics dataset using the standard CDISC key USUBJID automatically. The demographic columns (including ARM) appear to the right. No SQL, no dialog gymnastics.
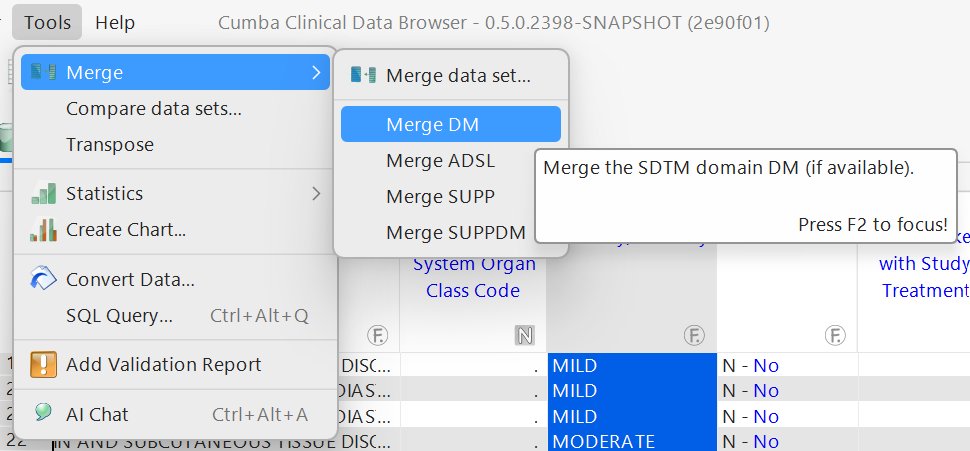
After the merge, the DM columns appear with blue-tinted column headers - Cumba marks merged-in columns visually so you can tell at a glance which variables came from where.
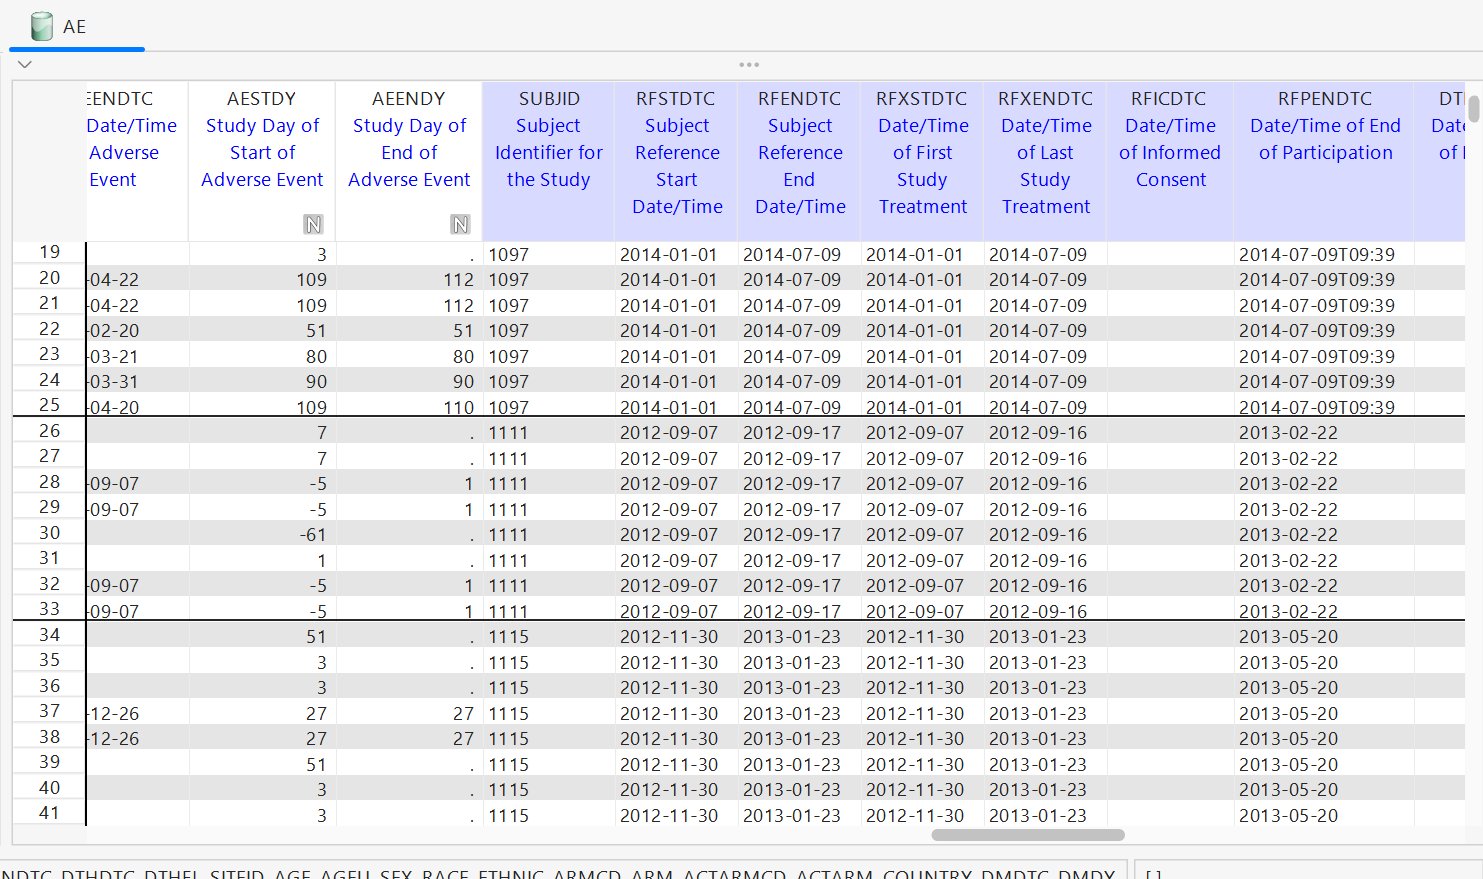
💡 The blue header tint is a visual reminder that these columns aren't native to the dataset you opened. Useful when you've done several merges and want to remember which fields are which.
Now go back and do Tools → Statistics → Create Frequency By with AESEV × ARM - the new tab shows the severity counts crossed with treatment arm.
The result tab Freq(AE[ARM, AESEV]) shows severity per treatment arm:
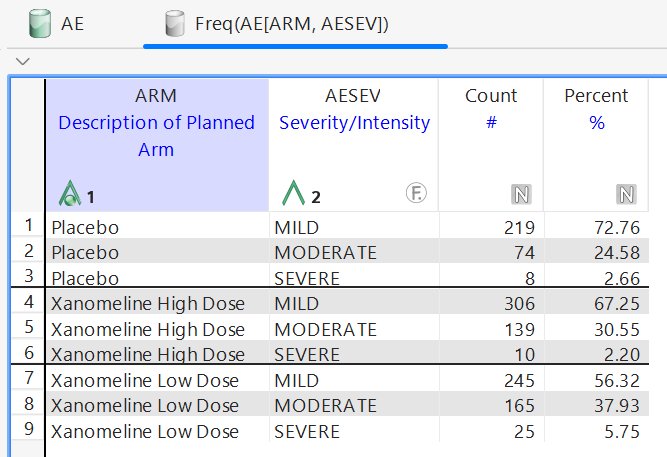
At a glance you can see whether one arm produces a different severity distribution than another - useful for a quick safety signal.
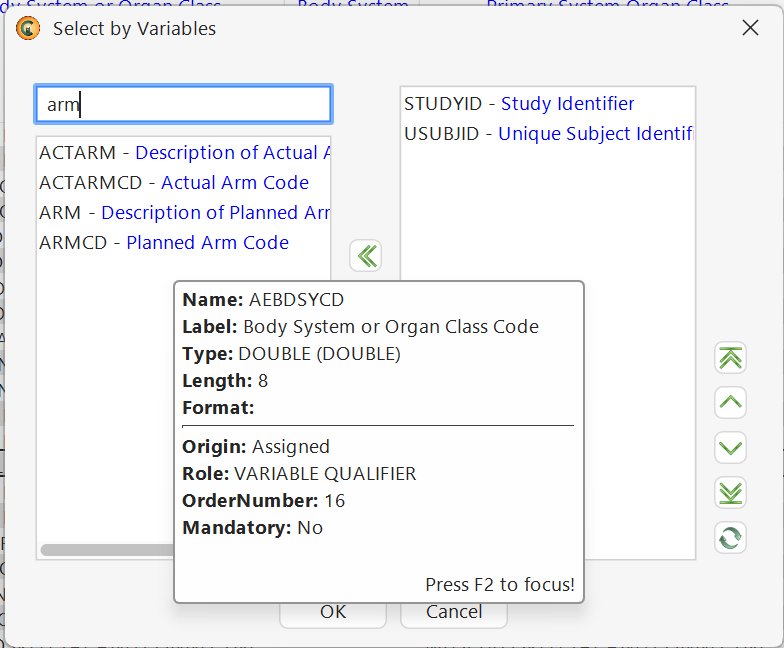
🦉 Don't remember the exact variable name? In the Select by Variables dialog, just start typing - Cumba searches both names and labels, the same as Find Column. Coming from ADaM and instinctively typing
trt? Tryarminstead - that's SDTM's name for treatment arm.💡 Variable metadata tooltips work everywhere a variable appears: in the data view, in the column header, and in any variable-picker dialog. Hover and pause to see Name, Label, Type, Length, Format, Origin, Role, OrderNumber and Mandatory - no matter where you are in Cumba.
💡 Frequency tabs are full datasets. You can filter and sort them like any other table.
10. Keep USUBJID and AETERM in sight
Now the table is wide and you want to scroll horizontally without losing the patient ID and event term as anchors. Two ways to achieve that:
The pragmatic way - hide redundant columns:
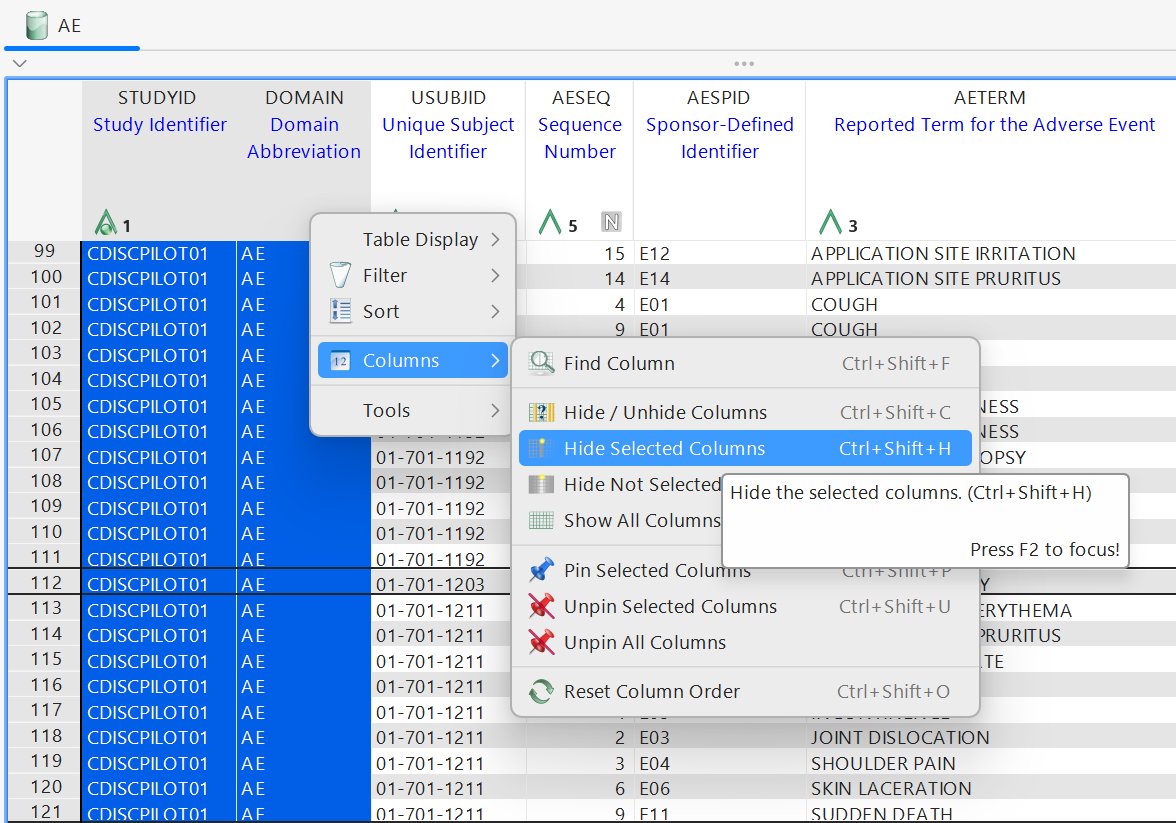
In a single-study dataset, STUDYID and DOMAIN are the same value in every row. Select them and press Ctrl+Shift+H (Columns → Hide Selected Columns). Now USUBJID and AETERM are the leftmost columns and stay in view naturally.
The literal way - pin the columns:
Select USUBJID and AETERM column headers (Ctrl-click for multi-select), then Ctrl+Shift+P (Columns → Pin Selected Columns). A vertical separator appears and those columns stay fixed while the rest scrolls.
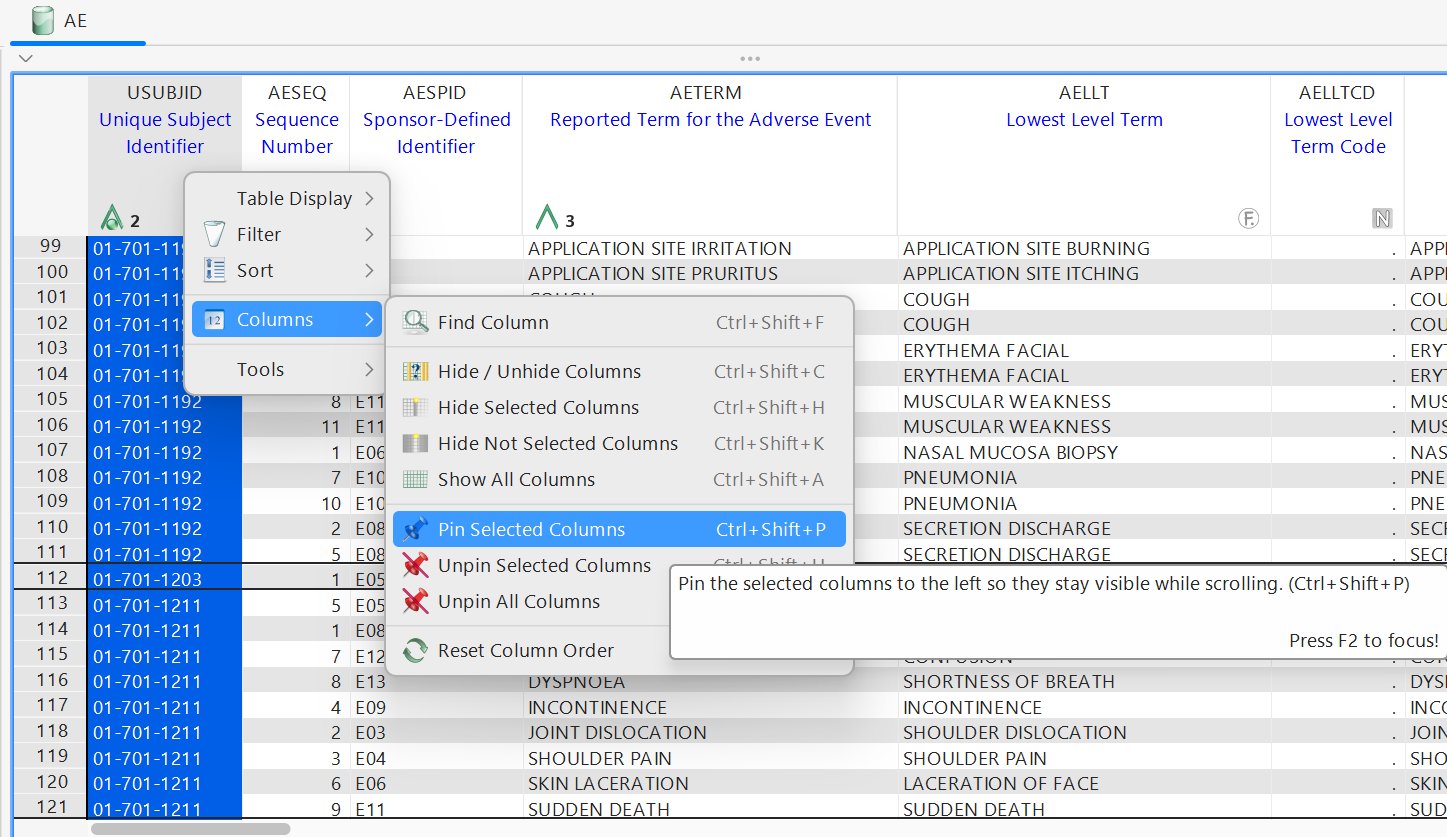
Now you can scroll all the way to the right and the two pinned columns stay in sight:
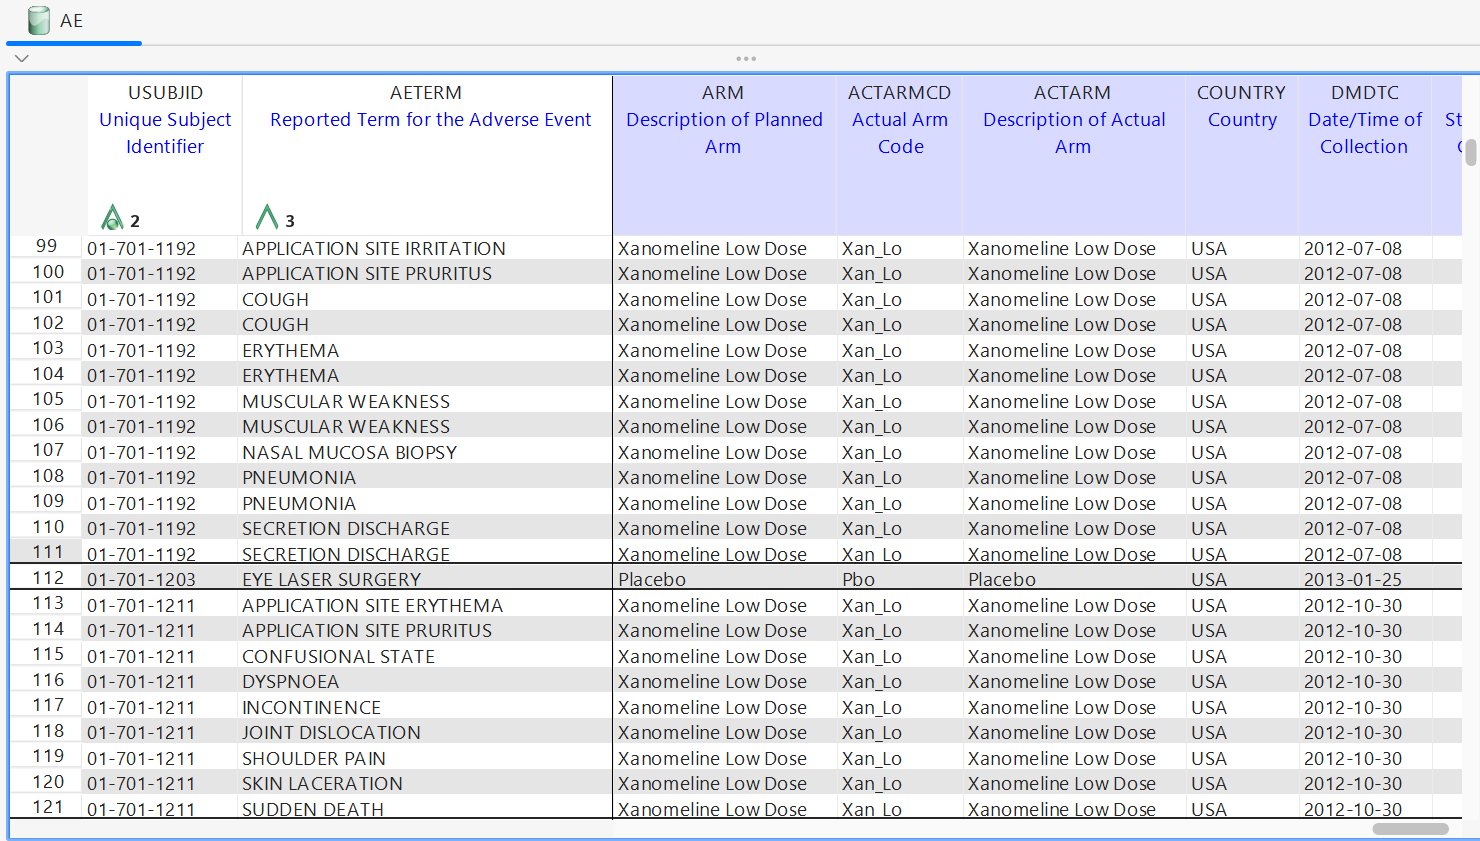
💡 Pinning works on a continuous left-most group: the selected columns are moved to the left and frozen. If the columns you want to pin are scattered across the table, you may want to drag them next to each other first - or simply hide what's in front of them, as in the pragmatic way above.
11. Memorize the filter
A more realistic memorize use case: you review the same patient repeatedly and want a one-click way to filter to their records.
Right-click the USUBJID column → Filter → Filter IN (or Ctrl+Alt+I). The picker opens - and as a bonus, it shows the count and percent of rows for each value right in the dialog:
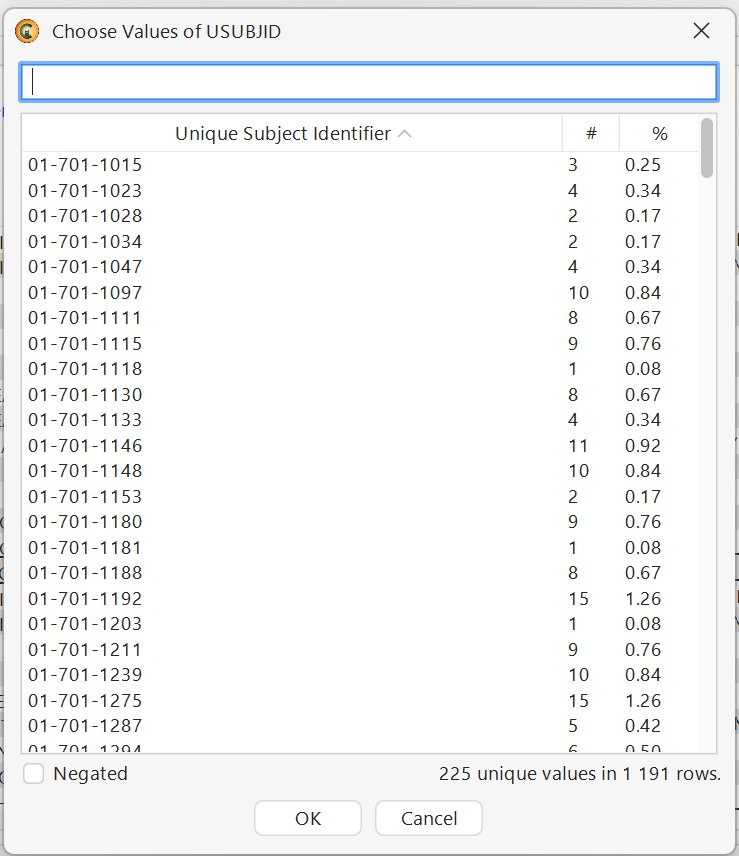
💡 The Filter IN dialog is essentially a mini-frequency. The patient with the most events (15) jumps out immediately - useful when you want to drill into "who has the most going on?".
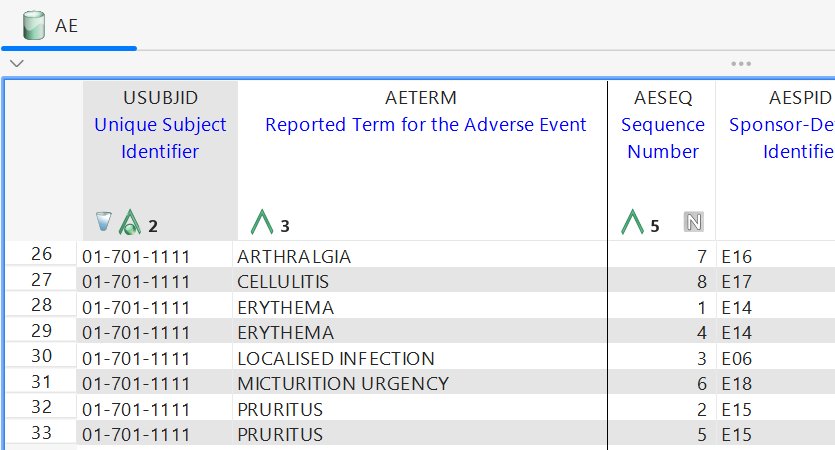
Pick the patient you want - for this walkthrough we go with 01-701-1111 (8 events, a manageable handful). Click OK. The dataset is now filtered to that one subject:
Now save the filter for next time: right-click the column → Filter → Memorized Filters → Memorize Current Filter… Give it a name - for this walkthrough we use "Patient 1111":
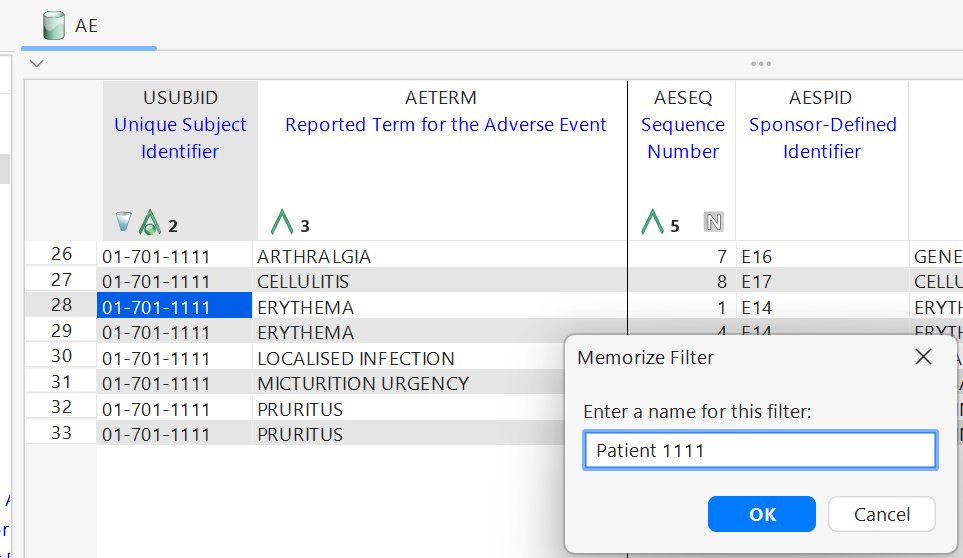
Next time you open this dataset, find the filter in the same submenu and one-click recall it. Memorized filters persist across sessions - close Cumba, reopen tomorrow, the named filter is still there.
12. Use the filter in another dataset
Memorized filters aren't tied to the dataset they were defined in. As long as the referenced variable exists, the named filter appears in any dataset's Filter → Memorized Filters submenu.
Open VS (Vital Signs) from the Library. Right-click USUBJID → Filter → Memorized Filters - "Patient 1111" is there. Hover and Cumba shows what it does: USUBJID IN ("01-701-1111").
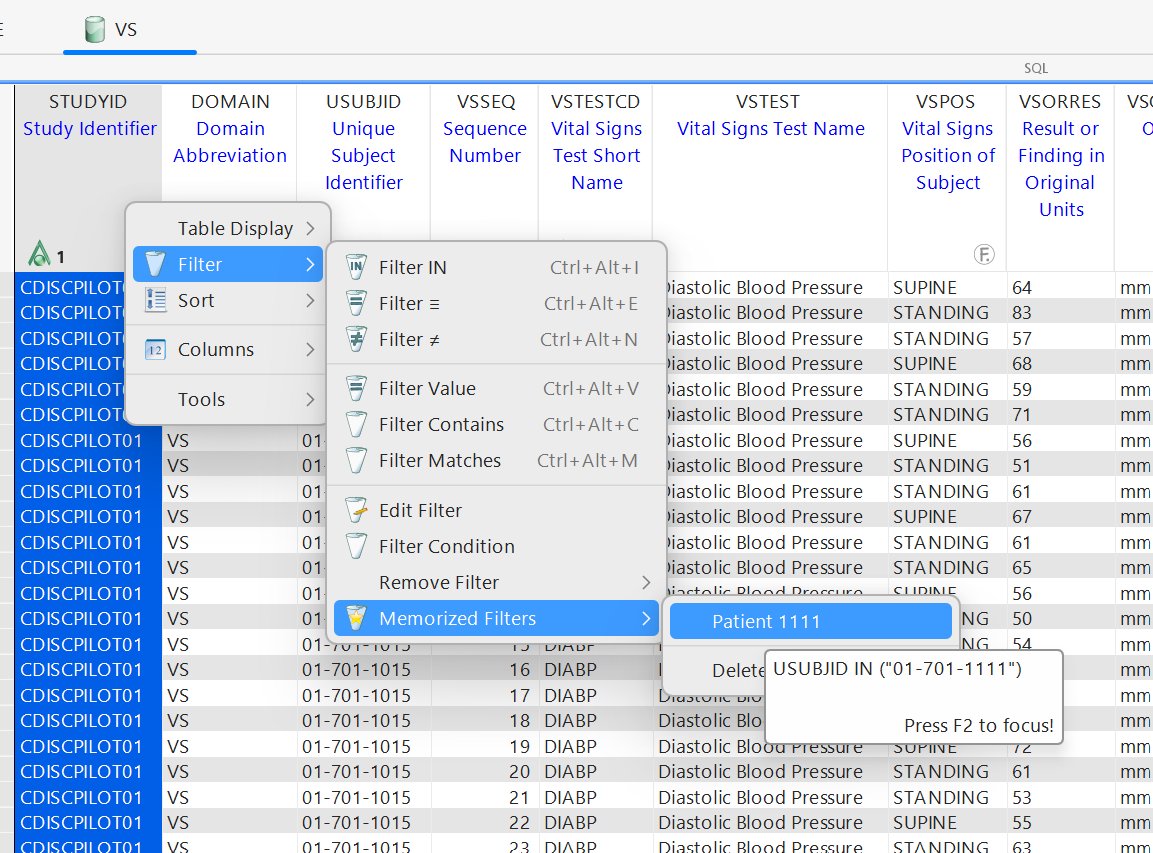
One click and VS is filtered to the same patient:
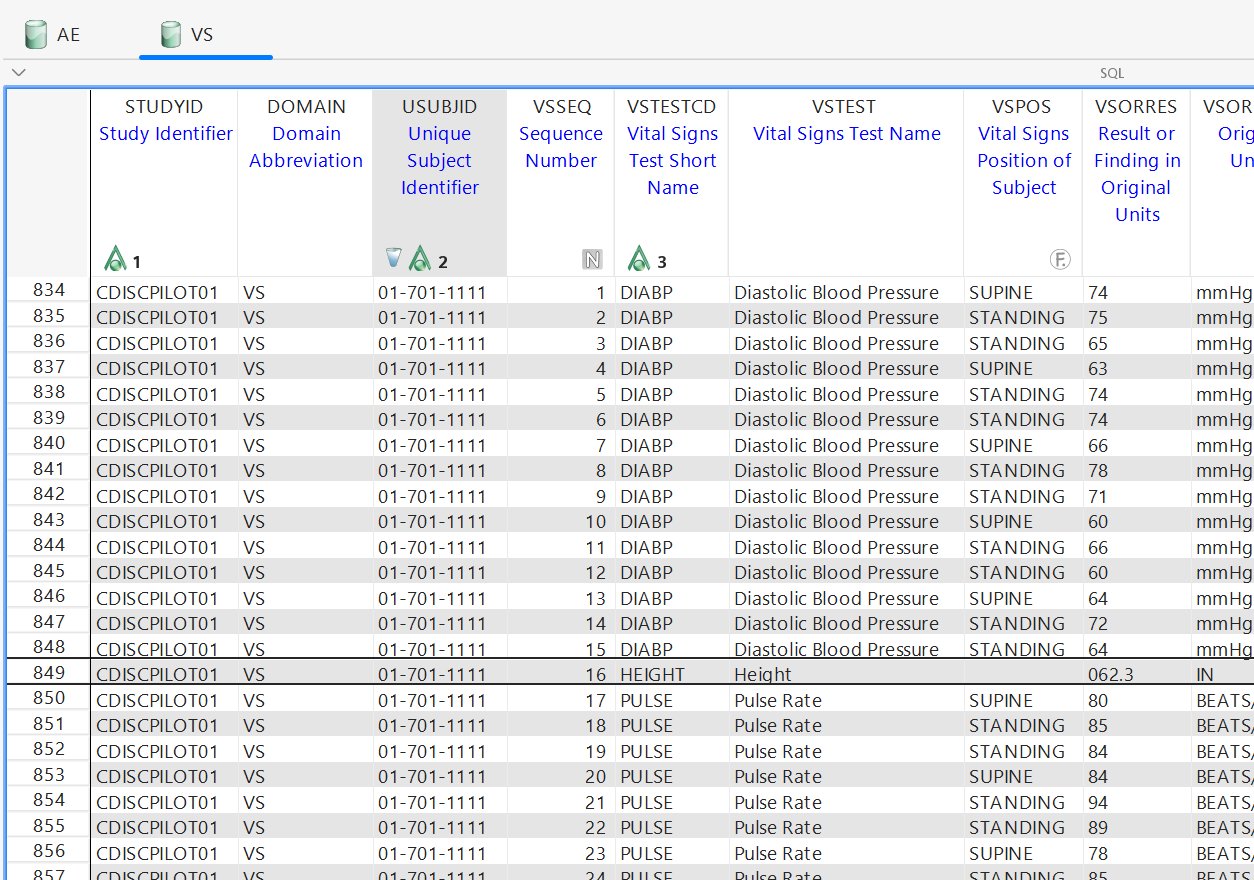
Same logic for LB, EX, EG, and every other domain that has USUBJID. Define once, use everywhere.
📝 Planned: apply a memorized filter to all open datasets at once - currently it has to be applied per dataset, but the same filter is available wherever the referenced variable exists.
Lazy mode: "I just want headaches"
You don't actually need to know the column name. You just want to see all the adverse events with headache.
- Open the AE dataset
- Press Ctrl+F for full-text search across all columns
- Type
headache - Cumba jumps to the first match and highlights all of them
That's it. No column knowledge, no SDTM version checking. For 80% of quick lookups, this is all you need.
🦉 Lazy combined with smart: use Ctrl+F to find headache rows, then right-click a headache cell → Filter ≡ to keep only those rows. Two clicks total.
What you just used
In one workflow you touched: Library, Find Column, Open Attached Format, variable tooltip, Sort, Filter (multi-value), Frequency, Frequency By, Merge DM, Hide / Pin Columns, Memorized Filter (cross-dataset), SQL Bar, full-text search. That's most of Cumba's daily-use surface.